Trace parameter state evolution
Source:R/trace_ParameterStateEvolution.R
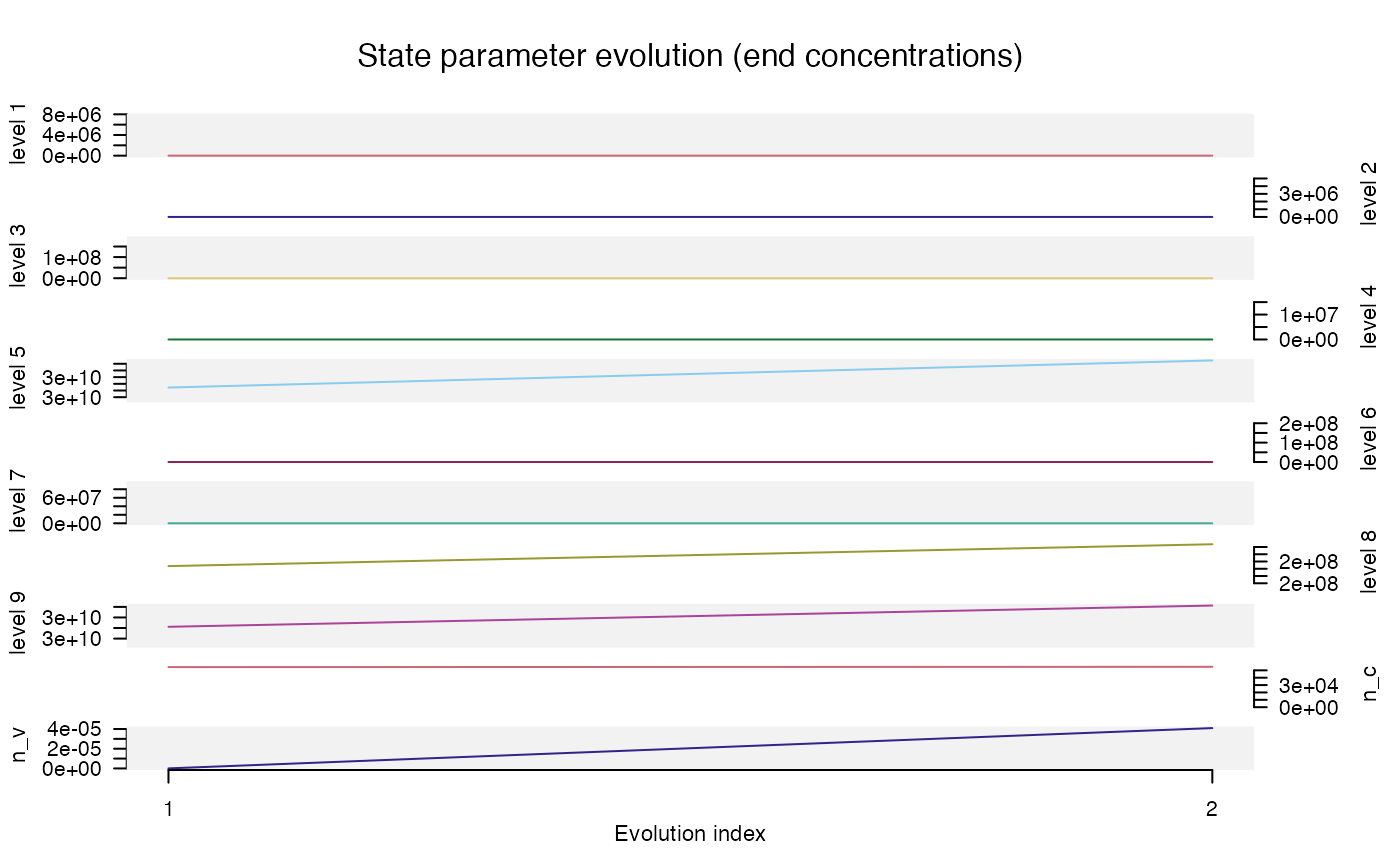
trace_ParameterStateEvolution.RdTraces the evolution of the concentrations in the different levels over different simulation steps. For instance, a sequence consisting of one TL and one OSL step has two iterations. For each step the end concentration is extracted. This way, the evolution of the system can be traced throughout a sequence.
trace_ParameterStateEvolution(object, step = NULL, plot = TRUE, ...)Arguments
- object
Luminescence::RLum.Analysis (required): input object created by the function model_LuminescenceSignals. The input can be a list of such objects
- step
character (optional): filter the input object to pick particular steps, the input is passed to Luminescence::get_RLum
- plot
logical (with default): enables/disables plot output
- ...
optional arguments to be passed to control the plot output. Supported are
xlim,xlab,ylab,log,col,type,bg,main,norm(TRUE/FALSE),grid(TRUE/FALSE),step_names(TRUE/FALSE) Where meaningful, parameters can be provided as vectors. Vectors short than the number of plots are recycled.
Value
Returns a plot and list with matrix objects of the parameter evolution. If
object is a list the output is a nested list
Function version
0.1.0
How to cite
Kreutzer, S., 2022. trace_ParameterStateEvolution(): Trace parameter state evolution. Function version 0.1.0. In: Friedrich, J., Kreutzer, S., Schmidt, C., 2022. RLumModel: Solving Ordinary Differential Equations to Understand Luminescence. R package version 0.2.10. https://CRAN.R-project.org/package=RLumModel