Visualise 'RLumCarlo' modelling results without extracting the values manually. Typically visualised are the averaged signal or the number of remaining electrons, with a polygon indicating modelling uncertainties.
Usage
plot_RLumCarlo(
  object,
  plot_value = "mean",
  plot_uncertainty = "range",
  FUN = NULL,
  norm = FALSE,
  add = FALSE,
  ...
)
Arguments
- object
list of class
RLumCarlo_Model_Output(required): input object to be plotted, usually the required input object is generated by one of the functions starting withrun_. Alternatively a list of such objects can be provided.- plot_value
character (with default): type of curve value to be displayed. Allowed are
mean(the default) andsum(meaningful if different systems are combined).NULLdisables the value visualisation.- plot_uncertainty
character (with default): type of the displayed uncertainty. Allowed values are
range,sd(standard deviation) andvar(variance).NULLdisables the uncertainty visualisation.- FUN
function (optional): own function that can be applied to the y-values before normalisation and plotting
- norm
logical (with default): normalise curve to the highest intensity value
- add
logical (with default): allows overplotting of results by adding curves to an existing plot. This argument is handled automatically if
objectis of type list- ...
further argument, that can be passed to control the plot output largely following the argument names in graphics::plot.default. Currently supported are:
xlab,ylab,xlim,ylim,main,lwd,type,pch,lty,col,grid,legend. The argumentslwd,type,pch,lty,colcan be provided as a vector ifobjectis a list
Details
For colouring the curves, the package khroma::khroma-package is used to provide colours that can be best distinguished, in particular by colour-blind users.
Author
Sebastian Kreutzer, Institute of Geography, Heidelberg University (Germany)
Johannes Friedrich, University of Bayreuth (Germany)
How to cite
Kreutzer, S., Friedrich, J., 2025. plot_RLumCarlo(): Plot RLumCarlo Monte-Carlo Simulation Results. Function version 0.1.0. In: Friedrich, J., Kreutzer, S., Pagonis, V., Schmidt, C., 2025. RLumCarlo: Monte-Carlo Methods for Simulating Luminescence Phenomena. R package version 0.1.10. https://r-lum.github.io/RLumCarlo/
Examples
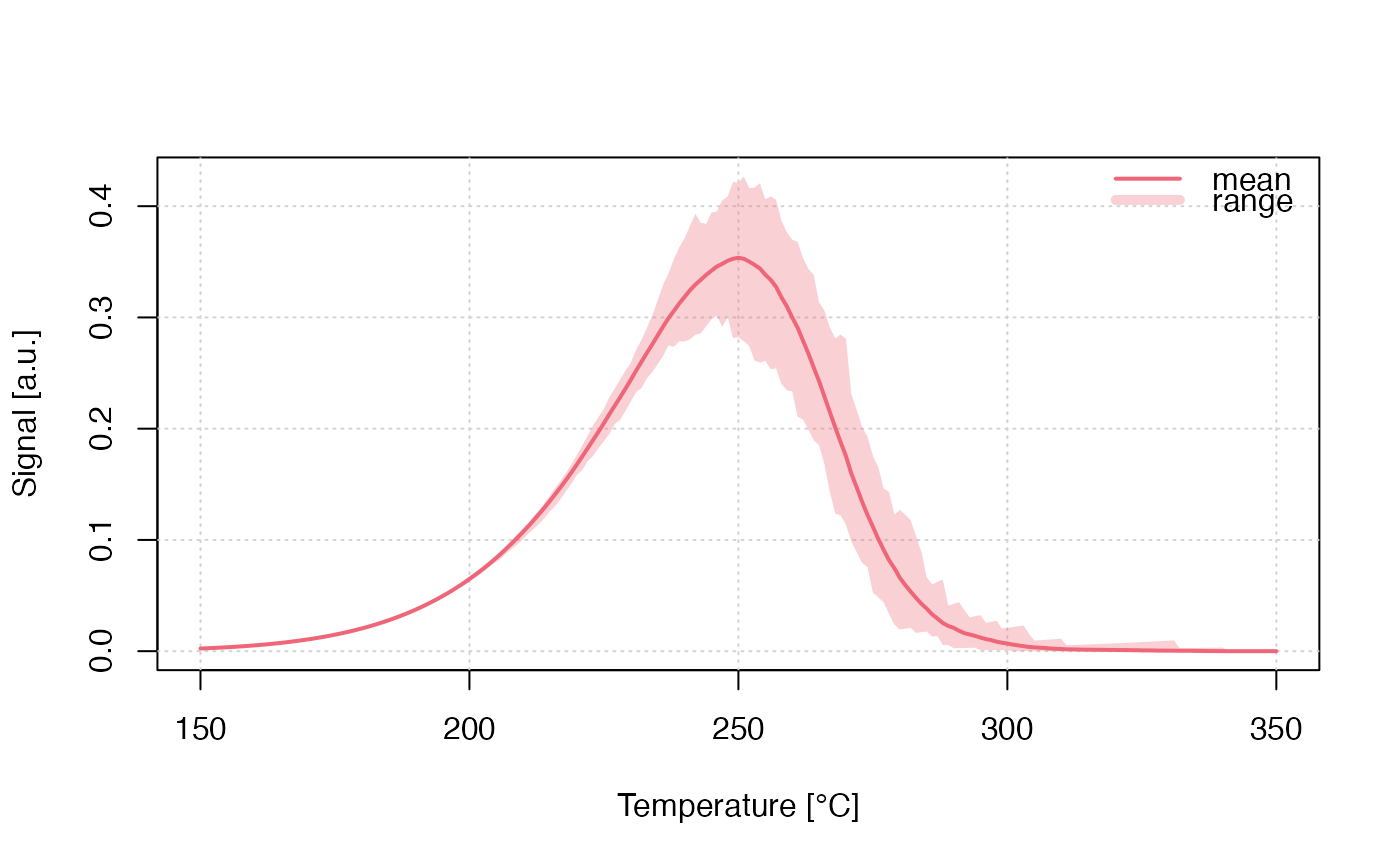
## plain plot
DELOC <- run_MC_TL_DELOC(
s = 3.5e12,
E = 1.45,
R = 0.1,
method = 'seq',
clusters = 100,
times = 150:350) %T>%
plot_RLumCarlo(legend = TRUE)
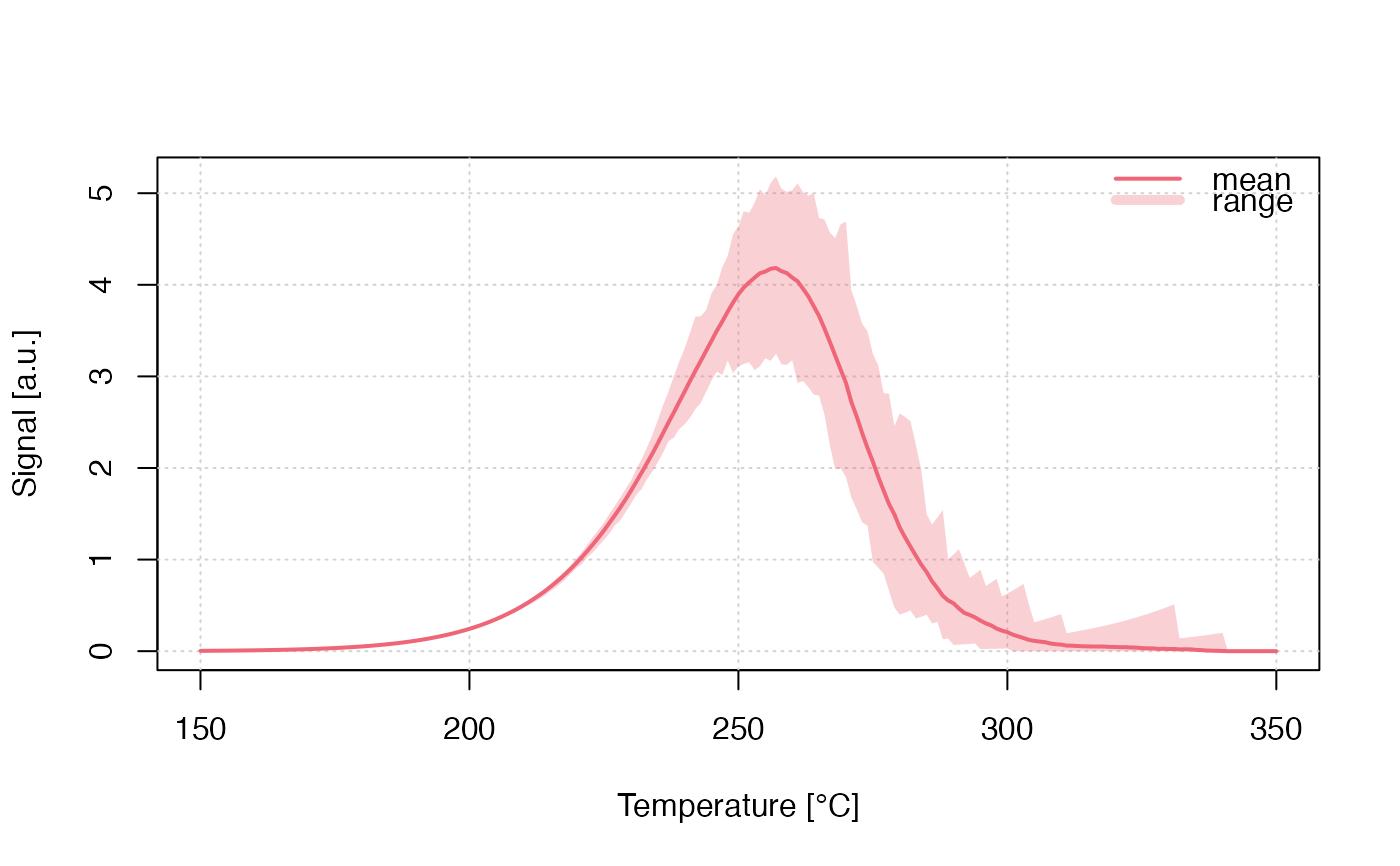 ## TL with FUN to correct for thermal
## quenching
f <- function(x) x * 1/(1 + (2e+6 * exp(-0.55/(8.617e-5 * (DELOC$time + 273)))))
plot_RLumCarlo(
object = DELOC,
FUN = f)
## TL with FUN to correct for thermal
## quenching
f <- function(x) x * 1/(1 + (2e+6 * exp(-0.55/(8.617e-5 * (DELOC$time + 273)))))
plot_RLumCarlo(
object = DELOC,
FUN = f)