This helper function returns a list with layout definitions for homogeneous plotting.
The easiest way to create a user-specific layout definition is perhaps to
create either an empty or a default layout object and fill/modify the
definitions (user.layout <- get_Layout(data = "empty")).
Arguments
- layout
character or list object (required): name of the layout definition to be returned. If name is provided the respective definition is returned. One of the following supported layout definitions is possible:
"default","journal.1","small","empty".User-specific layout definitions must be provided as a list object of predefined structure, see details.
How to cite
Dietze, M., 2026. get_Layout(): Collection of layout definitions. Function version 0.1. In: Kreutzer, S., Burow, C., Dietze, M., Fuchs, M.C., Schmidt, C., Fischer, M., Friedrich, J., Mercier, N., Philippe, A., Riedesel, S., Autzen, M., Mittelstrass, D., Gray, H.J., Galharret, J., Colombo, M., Steinbuch, L., Boer, A.d., Bluszcz, A., 2026. Luminescence: Comprehensive Luminescence Dating Data Analysis. R package version 1.2.1. https://r-lum.github.io/Luminescence/
Examples
## read example data set
data(ExampleData.DeValues, envir = environment())
## show structure of the default layout definition
layout.default <- get_Layout(layout = "default")
str(layout.default)
#> List of 2
#> $ abanico:List of 5
#> ..$ font.type:List of 14
#> .. ..$ main : chr ""
#> .. ..$ xlab1 : chr ""
#> .. ..$ xlab2 : chr ""
#> .. ..$ ylab : chr ""
#> .. ..$ zlab : chr ""
#> .. ..$ xtck1 : chr ""
#> .. ..$ xtck2 : chr ""
#> .. ..$ xtck3 : chr ""
#> .. ..$ ytck : chr ""
#> .. ..$ ztck : chr ""
#> .. ..$ mtext : chr ""
#> .. ..$ summary: chr ""
#> .. ..$ stats : chr ""
#> .. ..$ legend : chr ""
#> ..$ font.size:List of 15
#> .. ..$ main : num 12
#> .. ..$ xlab1 : num 12
#> .. ..$ xlab2 : num 12
#> .. ..$ xlab3 : num 12
#> .. ..$ ylab : num 12
#> .. ..$ zlab : num 12
#> .. ..$ xtck1 : num 12
#> .. ..$ xtck2 : num 12
#> .. ..$ xtck3 : num 12
#> .. ..$ ytck : num 12
#> .. ..$ ztck : num 12
#> .. ..$ mtext : num 10
#> .. ..$ summary: num 10
#> .. ..$ stats : num 10
#> .. ..$ legend : num 10
#> ..$ font.deco:List of 15
#> .. ..$ main : chr "bold"
#> .. ..$ xlab1 : chr "normal"
#> .. ..$ xlab2 : chr "normal"
#> .. ..$ xlab3 : chr "normal"
#> .. ..$ ylab : chr "normal"
#> .. ..$ zlab : chr "normal"
#> .. ..$ xtck1 : chr "normal"
#> .. ..$ xtck2 : chr "normal"
#> .. ..$ xtck3 : chr "normal"
#> .. ..$ ytck : chr "normal"
#> .. ..$ ztck : chr "normal"
#> .. ..$ mtext : chr "normal"
#> .. ..$ summary: chr "normal"
#> .. ..$ stats : chr "normal"
#> .. ..$ legend : chr "normal"
#> ..$ colour :List of 29
#> .. ..$ main : num 1
#> .. ..$ xlab1 : num 1
#> .. ..$ xlab2 : num 1
#> .. ..$ xlab3 : num 1
#> .. ..$ ylab : num 1
#> .. ..$ zlab : num 1
#> .. ..$ xtck1 : num 1
#> .. ..$ xtck2 : num 1
#> .. ..$ xtck3 : num 1
#> .. ..$ ytck : num 1
#> .. ..$ ztck : num 1
#> .. ..$ mtext : num 1
#> .. ..$ summary : num 1
#> .. ..$ stats : num 1
#> .. ..$ legend : num 1
#> .. ..$ centrality: num 1
#> .. ..$ value.dot : num 1
#> .. ..$ value.bar : num 1
#> .. ..$ value.rug : num 1
#> .. ..$ poly.line : logi NA
#> .. ..$ poly.fill : chr "#BFBFBF99"
#> .. ..$ bar.line : logi NA
#> .. ..$ bar.fill : chr "grey60"
#> .. ..$ kde.line : num 1
#> .. ..$ kde.fill : logi NA
#> .. ..$ grid.major: chr "grey80"
#> .. ..$ grid.minor: chr "none"
#> .. ..$ border : num 1
#> .. ..$ background: logi NA
#> ..$ dimension:List of 22
#> .. ..$ figure.width : chr "auto"
#> .. ..$ figure.height: chr "auto"
#> .. ..$ margin : num [1:4] 10 10 10 10
#> .. ..$ main.line : num 100
#> .. ..$ xlab1.line : num 90
#> .. ..$ xlab2.line : num 90
#> .. ..$ xlab3.line : num 90
#> .. ..$ ylab.line : num 100
#> .. ..$ zlab.line : num 70
#> .. ..$ xtck1.line : num 100
#> .. ..$ xtck2.line : num 100
#> .. ..$ xtck3.line : num 100
#> .. ..$ ytck.line : num 100
#> .. ..$ ztck.line : num 100
#> .. ..$ xtcl1 : num 100
#> .. ..$ xtcl2 : num 100
#> .. ..$ xtcl3 : num 100
#> .. ..$ ytcl : num 100
#> .. ..$ ztcl : num 100
#> .. ..$ rugl : num 100
#> .. ..$ mtext : num 100
#> .. ..$ summary.line : num 100
#> $ kde :List of 5
#> ..$ font.type:List of 9
#> .. ..$ main : chr ""
#> .. ..$ xlab : chr ""
#> .. ..$ ylab1 : chr ""
#> .. ..$ ylab2 : chr ""
#> .. ..$ xtck : chr ""
#> .. ..$ ytck1 : chr ""
#> .. ..$ ytck2 : chr ""
#> .. ..$ stats : chr ""
#> .. ..$ legend: chr ""
#> ..$ font.size:List of 10
#> .. ..$ main : num 14
#> .. ..$ xlab : num 12
#> .. ..$ ylab1 : num 12
#> .. ..$ ylab2 : num 12
#> .. ..$ xtck : num 12
#> .. ..$ ytck1 : num 12
#> .. ..$ ytck2 : num 12
#> .. ..$ mtext : num 10
#> .. ..$ stats : num 12
#> .. ..$ legend: num 12
#> ..$ font.deco:List of 9
#> .. ..$ main : chr "bold"
#> .. ..$ xlab : chr "normal"
#> .. ..$ ylab1 : chr "normal"
#> .. ..$ ylab2 : chr "normal"
#> .. ..$ xtck : chr "normal"
#> .. ..$ ytck1 : chr "normal"
#> .. ..$ ytck2 : chr "normal"
#> .. ..$ stats : chr "normal"
#> .. ..$ legend: chr "normal"
#> ..$ colour :List of 20
#> .. ..$ main : num 1
#> .. ..$ xlab : num 1
#> .. ..$ ylab1 : num 1
#> .. ..$ ylab2 : num 1
#> .. ..$ xtck : num 1
#> .. ..$ ytck1 : num 1
#> .. ..$ ytck2 : num 1
#> .. ..$ box : num 1
#> .. ..$ mtext : num 2
#> .. ..$ stats : num 1
#> .. ..$ kde.line : num 1
#> .. ..$ kde.fill : NULL
#> .. ..$ value.dot : num 1
#> .. ..$ value.bar : num 1
#> .. ..$ value.rug : num 1
#> .. ..$ boxplot.line: num 1
#> .. ..$ boxplot.fill: NULL
#> .. ..$ mean.point : num 1
#> .. ..$ sd.line : num 1
#> .. ..$ background : logi NA
#> ..$ dimension:List of 14
#> .. ..$ figure.width : chr "auto"
#> .. ..$ figure.height: chr "auto"
#> .. ..$ margin : num [1:4] 10 10 10 10
#> .. ..$ main.line : num 100
#> .. ..$ xlab.line : num 100
#> .. ..$ ylab1.line : num 100
#> .. ..$ ylab2.line : num 100
#> .. ..$ xtck.line : num 100
#> .. ..$ ytck1.line : num 100
#> .. ..$ ytck2.line : num 100
#> .. ..$ xtcl : num 100
#> .. ..$ ytcl1 : num 100
#> .. ..$ ytcl2 : num 100
#> .. ..$ stats.line : num 100
## show colour definitions for Abanico plot, only
layout.default$abanico$colour
#> $main
#> [1] 1
#>
#> $xlab1
#> [1] 1
#>
#> $xlab2
#> [1] 1
#>
#> $xlab3
#> [1] 1
#>
#> $ylab
#> [1] 1
#>
#> $zlab
#> [1] 1
#>
#> $xtck1
#> [1] 1
#>
#> $xtck2
#> [1] 1
#>
#> $xtck3
#> [1] 1
#>
#> $ytck
#> [1] 1
#>
#> $ztck
#> [1] 1
#>
#> $mtext
#> [1] 1
#>
#> $summary
#> [1] 1
#>
#> $stats
#> [1] 1
#>
#> $legend
#> [1] 1
#>
#> $centrality
#> [1] 1
#>
#> $value.dot
#> [1] 1
#>
#> $value.bar
#> [1] 1
#>
#> $value.rug
#> [1] 1
#>
#> $poly.line
#> [1] NA
#>
#> $poly.fill
#> [1] "#BFBFBF99"
#>
#> $bar.line
#> [1] NA
#>
#> $bar.fill
#> [1] "grey60"
#>
#> $kde.line
#> [1] 1
#>
#> $kde.fill
#> [1] NA
#>
#> $grid.major
#> [1] "grey80"
#>
#> $grid.minor
#> [1] "none"
#>
#> $border
#> [1] 1
#>
#> $background
#> [1] NA
#>
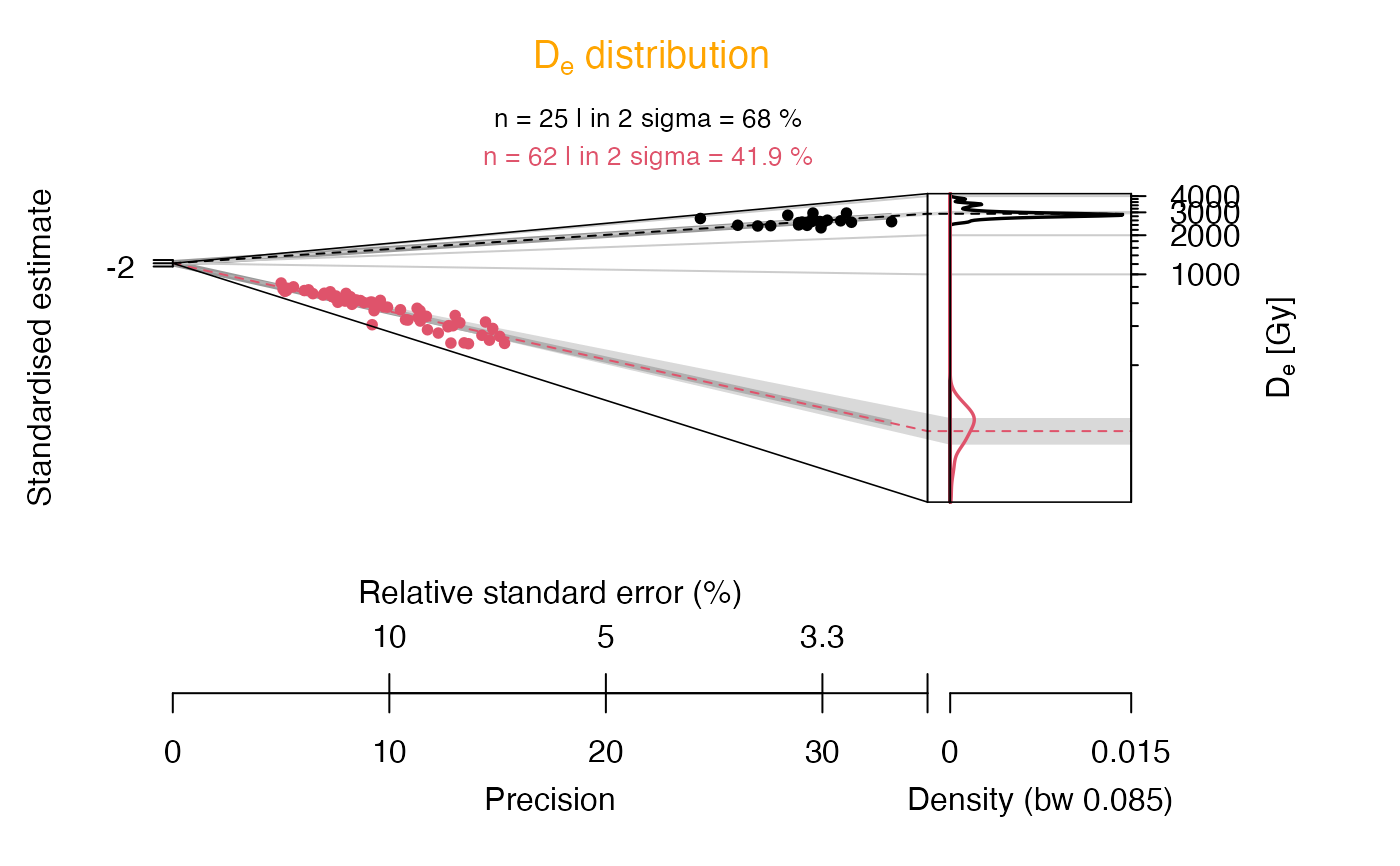
## set Abanico plot title colour to orange
layout.default$abanico$colour$main <- "orange"
## create Abanico plot with modofied layout definition
plot_AbanicoPlot(data = ExampleData.DeValues,
layout = layout.default)
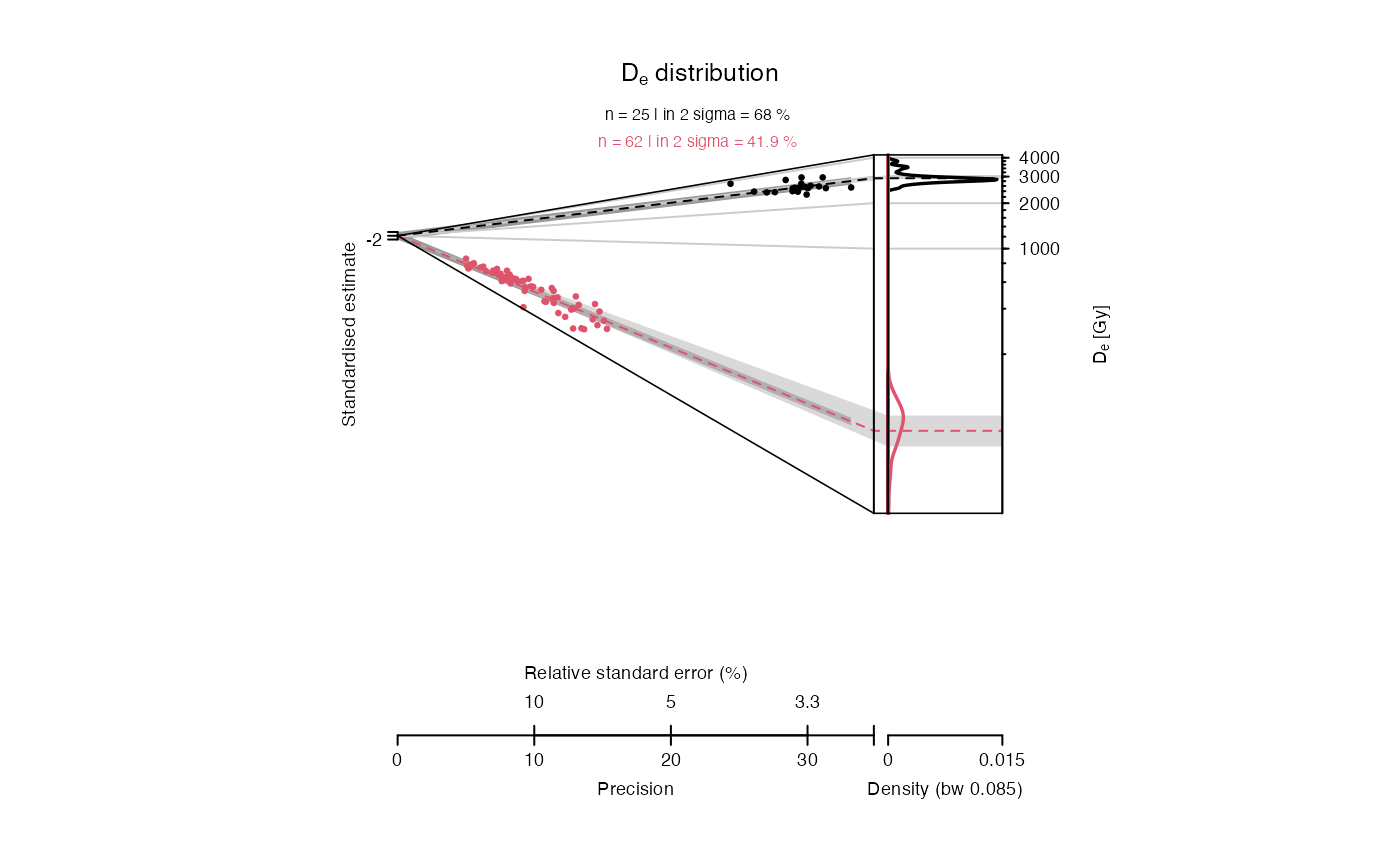
 ## create Abanico plot with predefined layout "journal"
plot_AbanicoPlot(data = ExampleData.DeValues,
layout = "journal")
## create Abanico plot with predefined layout "journal"
plot_AbanicoPlot(data = ExampleData.DeValues,
layout = "journal")