Moran Scatter Plot: Visualizing Spatial Dependency
Source:R/plot_MoranScatterplot.R
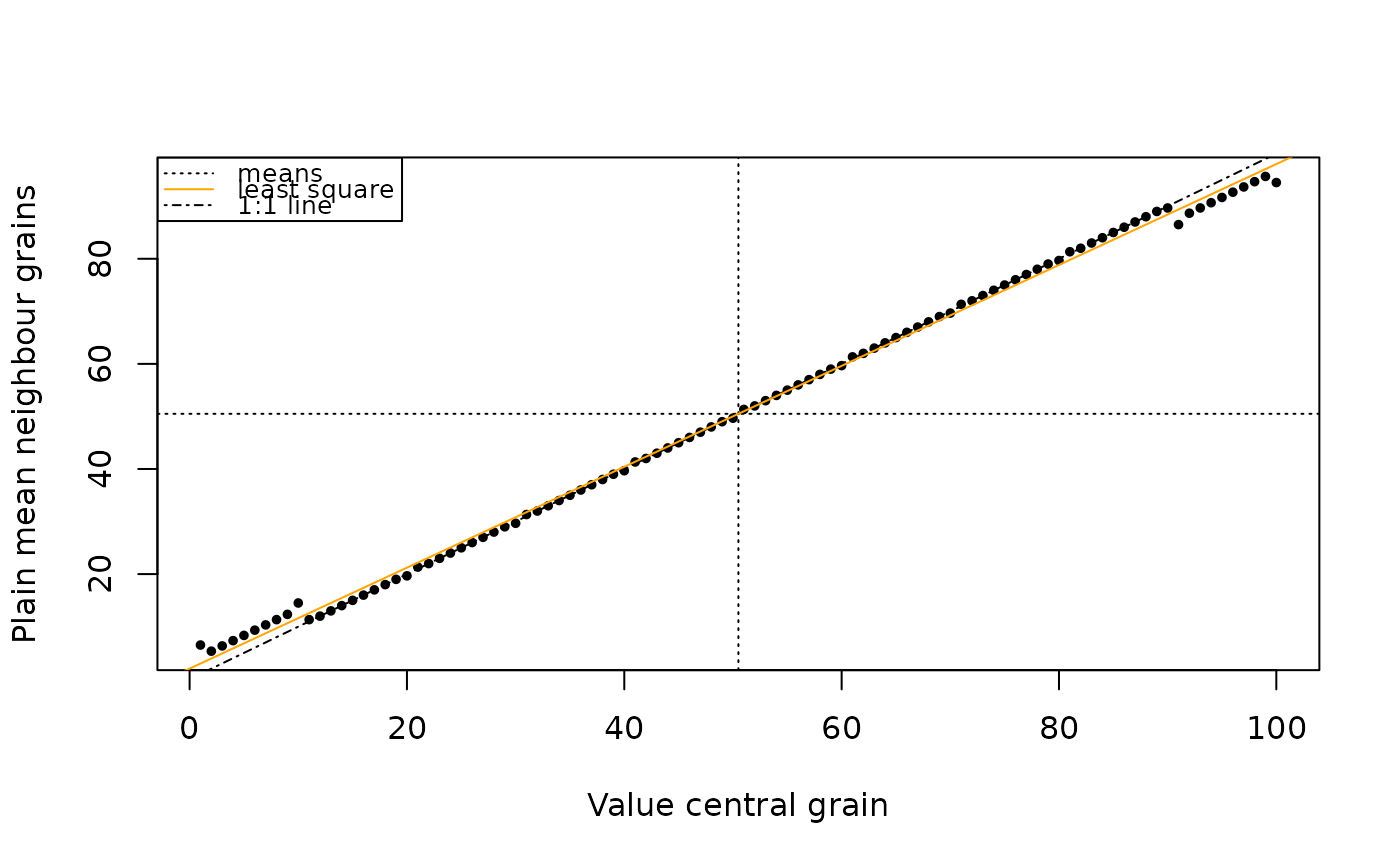
plot_MoranScatterplot.RdThe function produces a scatter plot, with on the x axis the original grain signal and on the y axis the weighted mean of the neighbour grain signals. The plot area is divided into four quadrants, and also a least square line (which slopes indicates, but not exactly represents, Moran's I) and an 1:1 line (which indicates a Moran's I of around 1).
Usage
plot_MoranScatterplot(
  object,
  df_neighbours = NULL,
  str_y_def = c("mean_neighbours", "weighted_sum"),
  ...
)
Arguments
- object
RLum.Results or numeric (required): containing a numerical vector of length 100, representing one or more measurement discs ("positions") in a reader. Each element in the vector represents one grain hole location on a disc.
- df_neighbours
data.frame (with default): Data frame indicating which borders to consider, and their respective weights (see the description provided for calc_MoransI). If
NULL(default), this is constructed automatically by the internal function.get_Neighbours.- str_y_def
character (with default): Calculation of y position. Defaults to
"mean_neighbours"which is the plain mean of all neighbour values and the most illustrative. The other option is"weighted_sum", which means the sum of the border weights times the neighbour values, which is actually closer to the way Moran's I is by default calculated in this package.- ...
Other parameters to be forwarded to the base R plot functions.
legend(TRUE/FALSE) to enable/disable the legend. Note thatxlab(x axis label),ylab(y axis label) andcex(scaling value) are given default values. Because of sometimes large value differences,log = "x",log = "y"andlog = "xy"are supported. In case of negative values and logarithmic plotting, values are increased so the smallest value to plot is 1. Summary elements such as means, least square line etc. will still be based on the linear case.pchaccepts options"show_location_ids"(plots grain location id's),"show_n_neighbours"(indicates numbers of neighbours) and the normal base plotpchoptions.
Value
Returns (invisibly) a data frame with plotting coordinates and grain location id's, for creating user-defined plots.
Details
Note that this function plots on the y-axis the mean of the neighbours, while the function calc_MoransI by default will for its global calculation weight every border the same. So, grain locations with 1, 2 or 3 neighbours will appear higher on the y-axis than their influence on Moran's I justify – apart from scaling, this explains a part of the differences of Moran's scatter plots between different packages. Also note that island' grain locations (=those not bordering other grains) are left out of these plots but might still influence Moran's I calculations.
How to cite
Boer, A.d., Steinbuch, L., 2026. plot_MoranScatterplot(): Moran Scatter Plot: Visualizing Spatial Dependency. In: Kreutzer, S., Burow, C., Dietze, M., Fuchs, M.C., Schmidt, C., Fischer, M., Friedrich, J., Mercier, N., Philippe, A., Riedesel, S., Autzen, M., Mittelstrass, D., Gray, H.J., Galharret, J., Colombo, M., Steinbuch, L., Boer, A.d., Bluszcz, A., 2026. Luminescence: Comprehensive Luminescence Dating Data Analysis. R package version 1.2.1. https://r-lum.github.io/Luminescence/
References
de Boer, A-M., Steinbuch, L., Heuvelink, G.B.M., Wallinga, J., 2025. A novel method to assess crosstalk in single-grain luminescence detection. Radiation Measurements 186, 107459. doi:10.1016/j.radmeas.2025.107459