Plot function for an RLum.Data.Spectrum S4 class object
Source:R/plot_RLum.Data.Spectrum.R
plot_RLum.Data.Spectrum.RdThe function provides a standardised plot output for spectrum data of an RLum.Data.Spectrum class object. The purpose of this function is to provide easy and straightforward spectra plotting, not a fully customised access to all plot parameters. If this is wanted, standard R plot functionality should be used instead.
Matrix structure
(cf. RLum.Data.Spectrum)
rows(x-values): wavelengths/channels (xlim,xlab)columns(y-values): time/temperature (ylim,ylab)cells(z-values): count values (zlim,zlab)
Note: This nomenclature is valid for all plot types of this function!
Nomenclature for value limiting
xlim: Limits values along the wavelength axisylim: Limits values along the time/temperature axiszlim: Limits values along the count value axis
Details on the plot functions
Spectrum is visualised as 3D or 2D plot. Both plot types are based on internal R plot functions.
plot.type = "persp"
Arguments that will be passed to graphics::persp:
shade: default is0.4phi: default is15theta: default is-30lphi: default is15ltheta: default is-30expand: default is1axes: default isTRUEbox: default isTRUE; accepts"alternate"for a custom plot designticktype: default isdetailed,r: default is10
Note: Further parameters can be adjusted via par. For example
to set the background transparent and reduce the thickness of the lines use:
par(bg = NA, lwd = 0.7) before the function call.
plot.type = "single"
Per frame a single curve is returned. Frames are time or temperature steps.
-frames: pick the frames to be plotted (depends on the binning!). Check without
this setting before plotting.
plot.type = "multiple.lines"
All frames plotted in one frame.
-frames: pick the frames to be plotted (depends on the binning!). Check without
this setting before plotting.
plot.type = "image" or plot.type = "contour"
These plot types use the R functions graphics::image or graphics::contour.
The advantage is that many plots can be arranged conveniently using standard
R plot functionality. If plot.type = "image" a contour is added by default,
which can be disabled using the argument contour = FALSE to add own contour
lines of choice.
plot.type = "transect"
Depending on the selected wavelength/channel range a transect over the
time/temperature (y-axis) will be plotted along the wavelength/channels
(x-axis). If the range contains more than one channel, values (z-values) are
summed up. To select a transect use the xlim argument, e.g.
xlim = c(300,310) plot along the summed up count values of channel
300 to 310.
Further arguments that will be passed (depending on the plot type)
xlab, ylab, zlab, xlim, ylim, zlim, main, mtext,
box, pch, type ("single", "multiple.lines", "interactive"),
col, border, lwd, bty, showscale ("interactive", "image")
contour, contour.col ("image"), labcex ("image", "contour"),
n_breaks ("image"), legend (TRUE/FALSE),
legend.pos ("image"), legend.horiz (TRUE/FALSE | "image")
Usage
plot_RLum.Data.Spectrum(
  object,
  par.local = TRUE,
  plot.type = c("contour", "persp", "single", "multiple.lines", "image", "transect",
    "interactive"),
  optical.wavelength.colours = TRUE,
  bg.spectrum = NULL,
  bg.channels = NULL,
  bin.rows = 1,
  bin.cols = 1,
  norm = FALSE,
  rug = TRUE,
  limit_counts = NULL,
  xaxis.energy = FALSE,
  legend.text = NULL,
  plot = TRUE,
  ...
)
Arguments
- object
RLum.Data.Spectrum or matrix (required): S4 object of class RLum.Data.Spectrum or a
matrixcontaining count values of the spectrum.
Please note that in case of a matrix row names and col names are set automatically if not provided.- par.local
logical (with default): use local graphical parameters for plotting, e.g. the plot is shown in one column and one row. If
par.local = FALSEglobal parameters are inherited.- plot.type
character (with default): for a 3D-plot use
"persp"or"interactive"; for a 2D-plot you can use"image","contour","single"or"multiple.lines"(along the time or temperature axis) or"transect"(along the wavelength axis).- optical.wavelength.colours
logical (with default): use optical wavelength colour palette. Note: For this, the spectrum range is limited:
c(350,750). Own colours can be set with the argumentcol. If you provide already binned spectra, the colour assignment is likely to be wrong, since the colour gradients are calculated using the bin number.- bg.spectrum
RLum.Data.Spectrum or matrix (optional): spectrum used for the background subtraction. The background spectrum should be measured using the same setting as the signal spectrum. The argument
bg.channelscontrols how the subtraction is performed: ifbg.channelsis not specified or the number of channels is identical between the signal and background spectra, a channel-wise subtraction is performed; otherwise, the arithmetic mean is calculated and subtracted from the signal.- bg.channels
vector (optional): channels used for background subtraction. If the number of channels is identical between the signal and background spectra, a channel-wise subtraction is performed; otherwise this number is used to select channels for calculating the arithmetic mean If a spectrum is provided via
bg.spectrum, this argument only works on the background spectrum.Note: Background subtraction is applied prior to channel binning!
- bin.rows
integer (with default): allow summing-up wavelength channels (horizontal binning), e.g.
bin.rows = 2two channels are summed up. Binning is applied after the background subtraction.- bin.cols
integer (with default): allow summing-up channel counts (vertical binning) for plotting, e.g.
bin.cols = 2two channels are summed up. Binning is applied after the background subtraction.- norm
logical, character (optional): if logical, whether curve normalisation should occur (
FALSEby default); alternatively, one of the values detailed in plot_RLum.Data.Curve. The normalisation is applied after binning.- rug
logical (with default): enable/disable colour rug. Currently only implemented for plot type
multiple.linesandsingle.- limit_counts
numeric (optional): value to limit all count values to this value, i.e. all count values above this threshold will be replaced by this threshold. This is helpful especially in case of TL-spectra.
- xaxis.energy
logical (with default): enable/disable using energy instead of wavelength on the x-axis. Function convert_Wavelength2Energy is used to perform the conversion.
Note: Besides being used in setting the axis, with this option the the spectrum is recalculated in terms of intensity, see details.
- legend.text
character (with default): possibility to provide own legend text. This argument is only considered for plot types providing a legend, e.g.
plot.type = "transect".- plot
logical (with default): enable/disable the plot output. If the plot output is disabled, the matrix used for the plotting and the calculated colour values (as attributes) are returned. This way, the (binned, transformed etc.) output can be used in other functions and packages, such as plotting with the package
'plot3D'.- ...
further arguments and graphical parameters that will be passed to the
plotfunction.
Value
Returns a plot and the transformed matrix used for plotting with some
useful attributes such as colour and pmat (the transpose matrix from
graphics::persp).
Author
Sebastian Kreutzer, F2.1 Geophysical Parametrisation/Regionalisation, LIAG - Institute for Applied Geophysics (Germany) , RLum Developer Team
How to cite
Kreutzer, S., 2026. plot_RLum.Data.Spectrum(): Plot function for an RLum.Data.Spectrum S4 class object. Function version 0.6.13. In: Kreutzer, S., Burow, C., Dietze, M., Fuchs, M.C., Schmidt, C., Fischer, M., Friedrich, J., Mercier, N., Philippe, A., Riedesel, S., Autzen, M., Mittelstrass, D., Gray, H.J., Galharret, J., Colombo, M., Steinbuch, L., Boer, A.d., Bluszcz, A., 2026. Luminescence: Comprehensive Luminescence Dating Data Analysis. R package version 1.2.1. https://r-lum.github.io/Luminescence/
Examples
##load example data
data(ExampleData.XSYG, envir = environment())
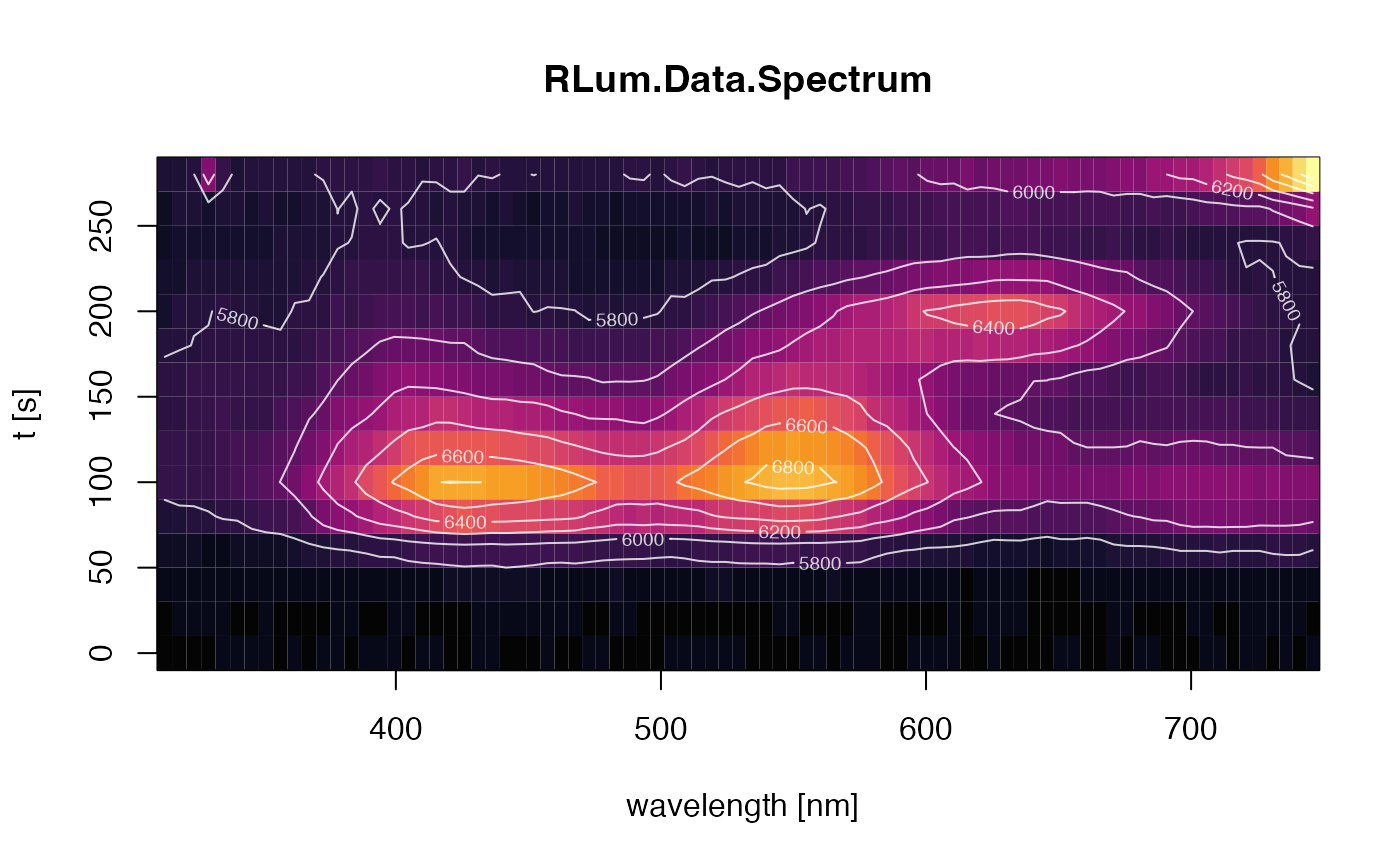
##(1)plot simple spectrum (2D) - image
plot_RLum.Data.Spectrum(
TL.Spectrum,
plot.type="image",
xlim = c(310,750),
ylim = c(0,300),
bin.rows=10,
bin.cols = 1)
#> Warning: [plot_RLum.Data.Spectrum()] 6 channels removed due to row (wavelength) binning
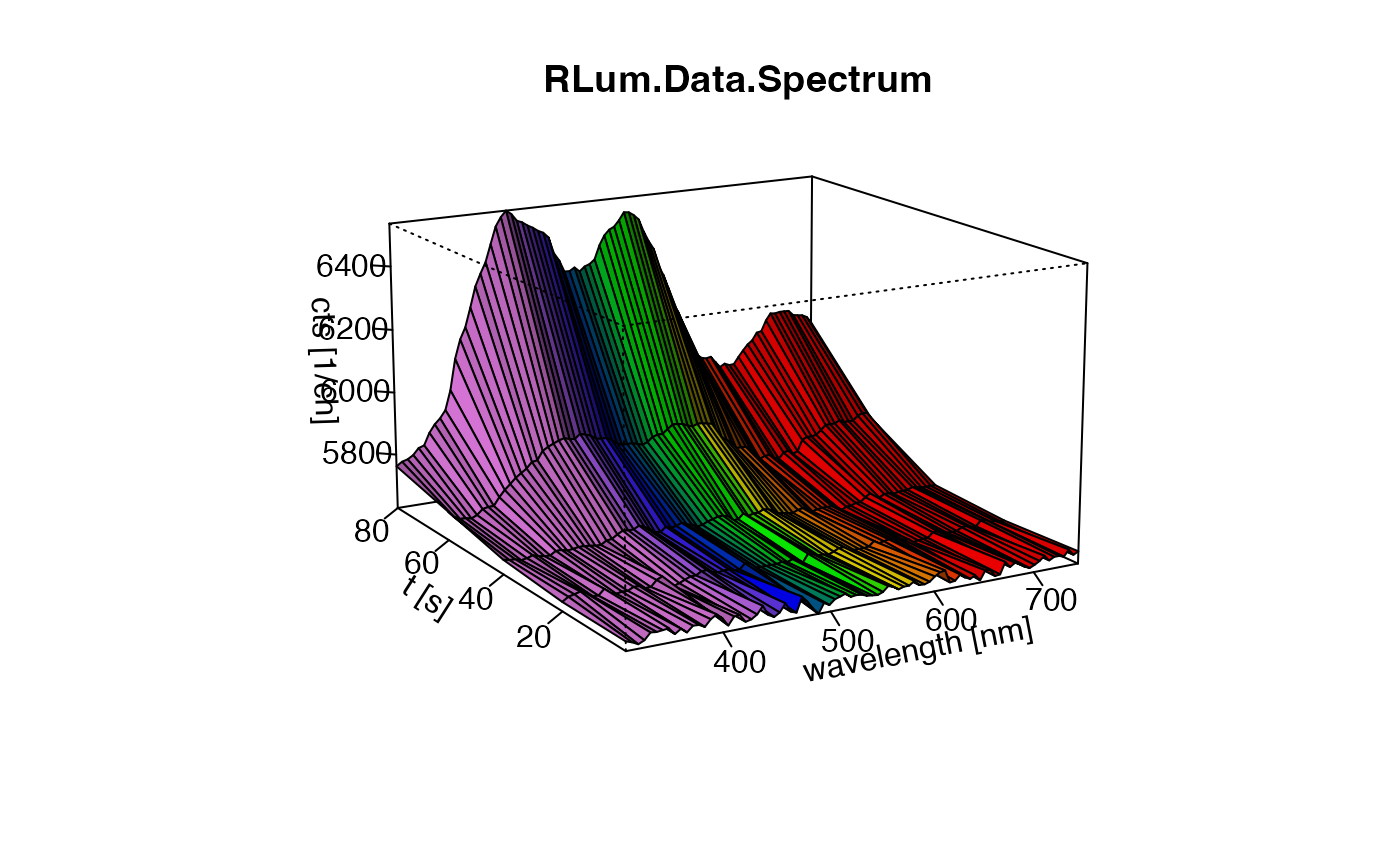
 ##(2) plot spectrum (3D)
plot_RLum.Data.Spectrum(
TL.Spectrum,
plot.type="persp",
xlim = c(310,750),
ylim = c(0,100),
bin.rows=10,
bin.cols = 1)
#> Warning: [plot_RLum.Data.Spectrum()] 6 channels removed due to row (wavelength) binning
##(2) plot spectrum (3D)
plot_RLum.Data.Spectrum(
TL.Spectrum,
plot.type="persp",
xlim = c(310,750),
ylim = c(0,100),
bin.rows=10,
bin.cols = 1)
#> Warning: [plot_RLum.Data.Spectrum()] 6 channels removed due to row (wavelength) binning
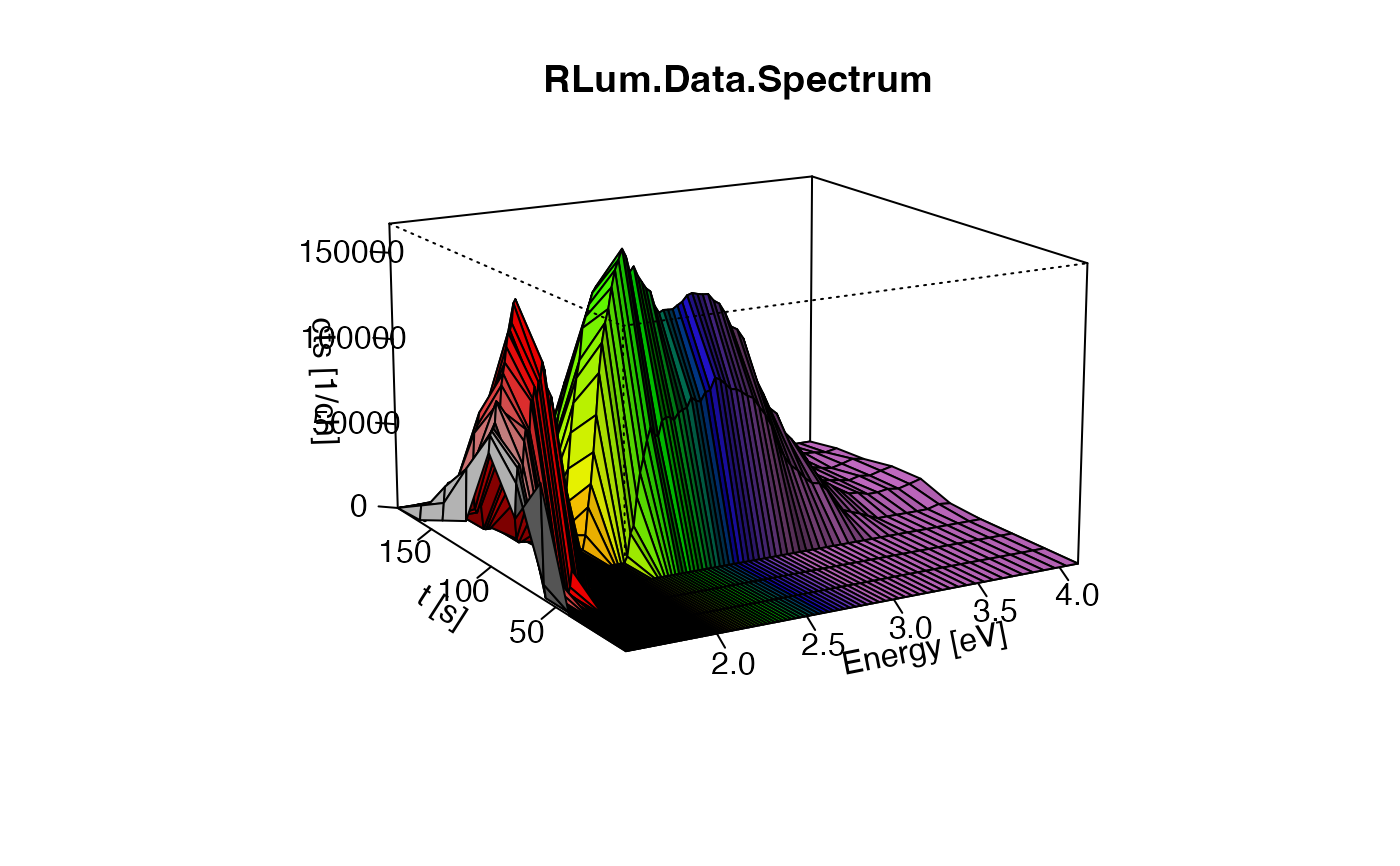
 ##(3) plot spectrum on energy axis
##please note the background subtraction
plot_RLum.Data.Spectrum(TL.Spectrum,
plot.type="persp",
ylim = c(0,200),
bin.rows=10,
bg.channels = 10,
bin.cols = 1,
xaxis.energy = TRUE)
#> Warning: [plot_RLum.Data.Spectrum()] 3 channels removed due to row (wavelength) binning
##(3) plot spectrum on energy axis
##please note the background subtraction
plot_RLum.Data.Spectrum(TL.Spectrum,
plot.type="persp",
ylim = c(0,200),
bin.rows=10,
bg.channels = 10,
bin.cols = 1,
xaxis.energy = TRUE)
#> Warning: [plot_RLum.Data.Spectrum()] 3 channels removed due to row (wavelength) binning
 ##(4) plot multiple lines (2D) - multiple.lines (with ylim)
plot_RLum.Data.Spectrum(
TL.Spectrum,
plot.type="multiple.lines",
xlim = c(310,750),
ylim = c(0,100),
bin.rows=10,
bin.cols = 1)
#> Warning: [plot_RLum.Data.Spectrum()] 6 channels removed due to row (wavelength) binning
##(4) plot multiple lines (2D) - multiple.lines (with ylim)
plot_RLum.Data.Spectrum(
TL.Spectrum,
plot.type="multiple.lines",
xlim = c(310,750),
ylim = c(0,100),
bin.rows=10,
bin.cols = 1)
#> Warning: [plot_RLum.Data.Spectrum()] 6 channels removed due to row (wavelength) binning
 if (FALSE) { # \dontrun{
##(4) interactive plot using the package plotly ("surface")
plot_RLum.Data.Spectrum(TL.Spectrum, plot.type="interactive",
xlim = c(310,750), ylim = c(0,300), bin.rows=10,
bin.cols = 1)
##(5) interactive plot using the package plotly ("contour")
plot_RLum.Data.Spectrum(TL.Spectrum, plot.type="interactive",
xlim = c(310,750), ylim = c(0,300), bin.rows=10,
bin.cols = 1,
type = "contour",
showscale = TRUE)
##(6) interactive plot using the package plotly ("heatmap")
plot_RLum.Data.Spectrum(TL.Spectrum, plot.type="interactive",
xlim = c(310,750), ylim = c(0,300), bin.rows=10,
bin.cols = 1,
type = "heatmap",
showscale = TRUE)
} # }
if (FALSE) { # \dontrun{
##(4) interactive plot using the package plotly ("surface")
plot_RLum.Data.Spectrum(TL.Spectrum, plot.type="interactive",
xlim = c(310,750), ylim = c(0,300), bin.rows=10,
bin.cols = 1)
##(5) interactive plot using the package plotly ("contour")
plot_RLum.Data.Spectrum(TL.Spectrum, plot.type="interactive",
xlim = c(310,750), ylim = c(0,300), bin.rows=10,
bin.cols = 1,
type = "contour",
showscale = TRUE)
##(6) interactive plot using the package plotly ("heatmap")
plot_RLum.Data.Spectrum(TL.Spectrum, plot.type="interactive",
xlim = c(310,750), ylim = c(0,300), bin.rows=10,
bin.cols = 1,
type = "heatmap",
showscale = TRUE)
} # }