The function creates ROI graphic with data extracted from the data imported via read_RF2R. This function might be of use to work with reduced data from spatially resolved measurements. The plot dimensions mimic the original image dimensions.
Usage
plot_ROI(
  object,
  exclude_ROI = 1,
  dist_thre = -Inf,
  dim.CCD = NULL,
  bg_image = NULL,
  plot = TRUE,
  ...
)
Arguments
- object
RLum.Analysis, RLum.Results or a list of such objects (required): input data created either by read_RF2R or extract_ROI.
- exclude_ROI
numeric (with default): option to remove particular ROIs from the analysis. Those ROIs are plotted but not coloured and not taken into account in distance analysis.
NULLexcludes nothing.- dist_thre
numeric (optional): euclidean distance threshold in pixel distance. All ROI for which the euclidean distance is smaller are marked. This helps to identify ROIs that might be affected by signal cross-talk. Note: the distance is calculated from the centre of an ROI, e.g., the threshold should include consider the ROIs or grain radius.
- dim.CCD
numeric (optional): metric x and y for the recorded (chip) surface in µm. For instance
c(8192, 8192), if set additional x and y-axes are shown.- bg_image
RLum.Data.Image (optional): background image object (please note that dimensions are not checked).
- plot
logical (with default): enable/disable the plot output.
- ...
further parameters to manipulate the plot. Besides the standard arguments of graphics::plot.default, the following arguments are supported:
lwd.ROI,lty.ROI,col.ROI,col.pixel,text.labels,text.offset,grid(TRUE/FALSE),legend(TRUE/FALSE),legend.text,legend.pos
Value
An ROI plot and an RLum.Results object with a matrix containing the extracted ROI data and a object produced by stats::dist containing the euclidean distance between the ROIs.
Author
Sebastian Kreutzer, F2.1 Geophysical Parametrisation/Regionalisation, LIAG - Institute for Applied Geophysics (Germany) , RLum Developer Team
How to cite
Kreutzer, S., 2026. plot_ROI(): Create Regions of Interest (ROI) Graphic. Function version 0.2.0. In: Kreutzer, S., Burow, C., Dietze, M., Fuchs, M.C., Schmidt, C., Fischer, M., Friedrich, J., Mercier, N., Philippe, A., Riedesel, S., Autzen, M., Mittelstrass, D., Gray, H.J., Galharret, J., Colombo, M., Steinbuch, L., Boer, A.d., Bluszcz, A., 2026. Luminescence: Comprehensive Luminescence Dating Data Analysis. R package version 1.2.1. https://r-lum.github.io/Luminescence/
Examples
## simple example
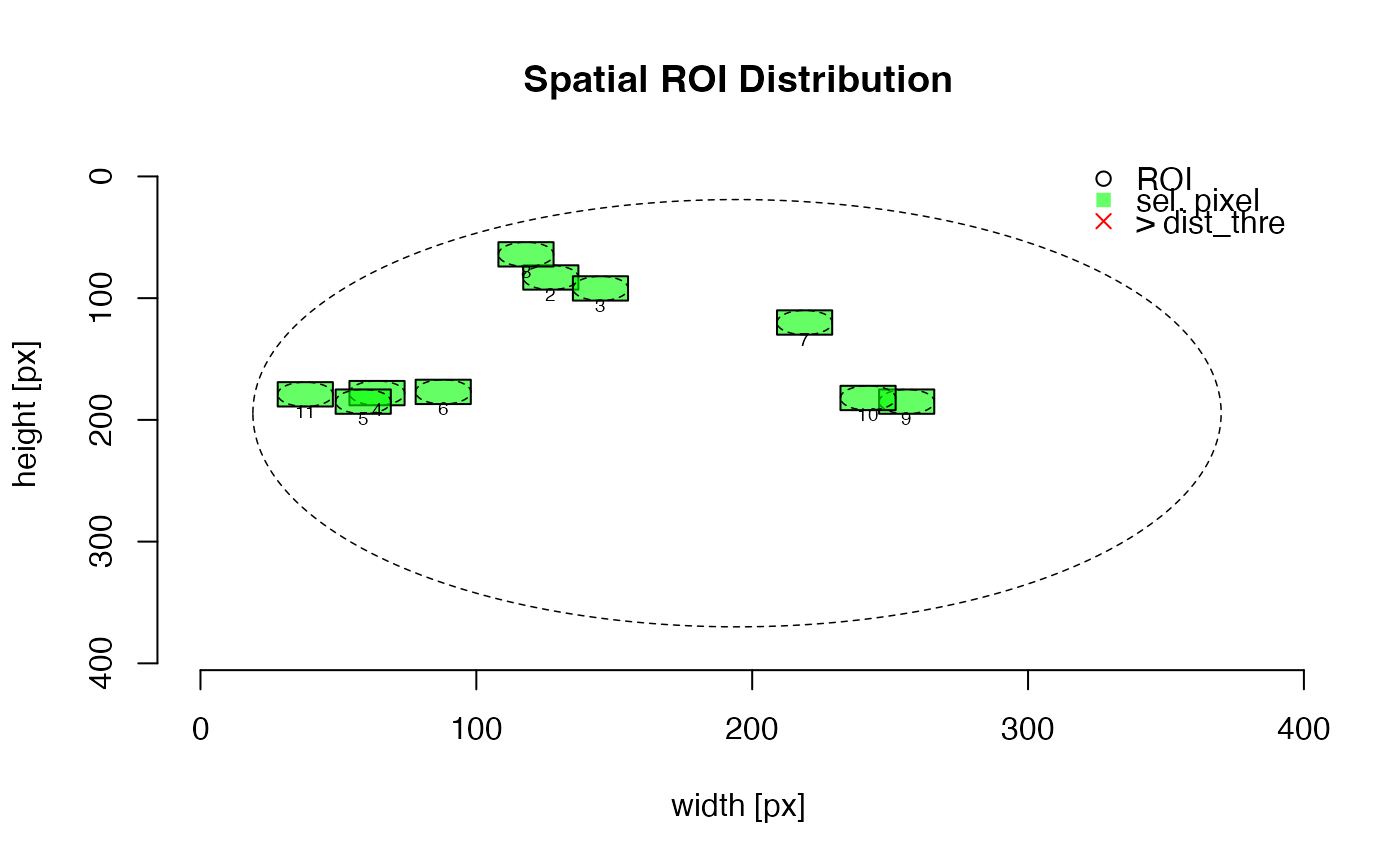
file <- system.file("extdata", "RF_file.rf", package = "Luminescence")
temp <- read_RF2R(file)
#>
#> [read_RF2R()] Importing ...
#> path: /home/runner/work/_temp/Library/Luminescence/extdata
#> file: RF_file.rf
plot_ROI(temp)
 ## in combination with extract_ROI()
m <- matrix(runif(100,0,255), ncol = 10, nrow = 10)
roi <- matrix(c(2.,4,2,5,6,7,3,1,1), ncol = 3)
t <- extract_ROI(object = m, roi = roi)
plot_ROI(t, bg_image = m)
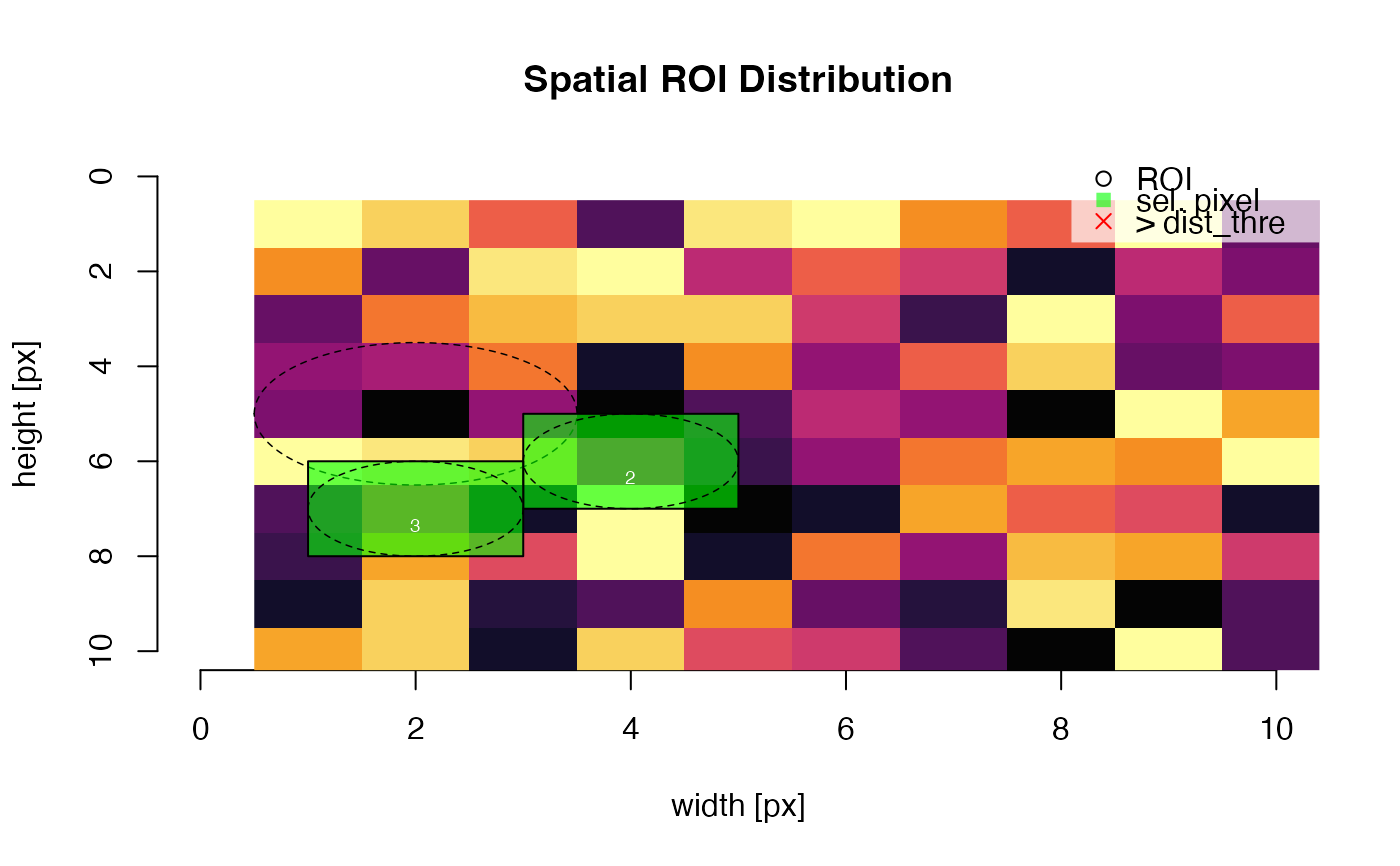
## in combination with extract_ROI()
m <- matrix(runif(100,0,255), ncol = 10, nrow = 10)
roi <- matrix(c(2.,4,2,5,6,7,3,1,1), ncol = 3)
t <- extract_ROI(object = m, roi = roi)
plot_ROI(t, bg_image = m)