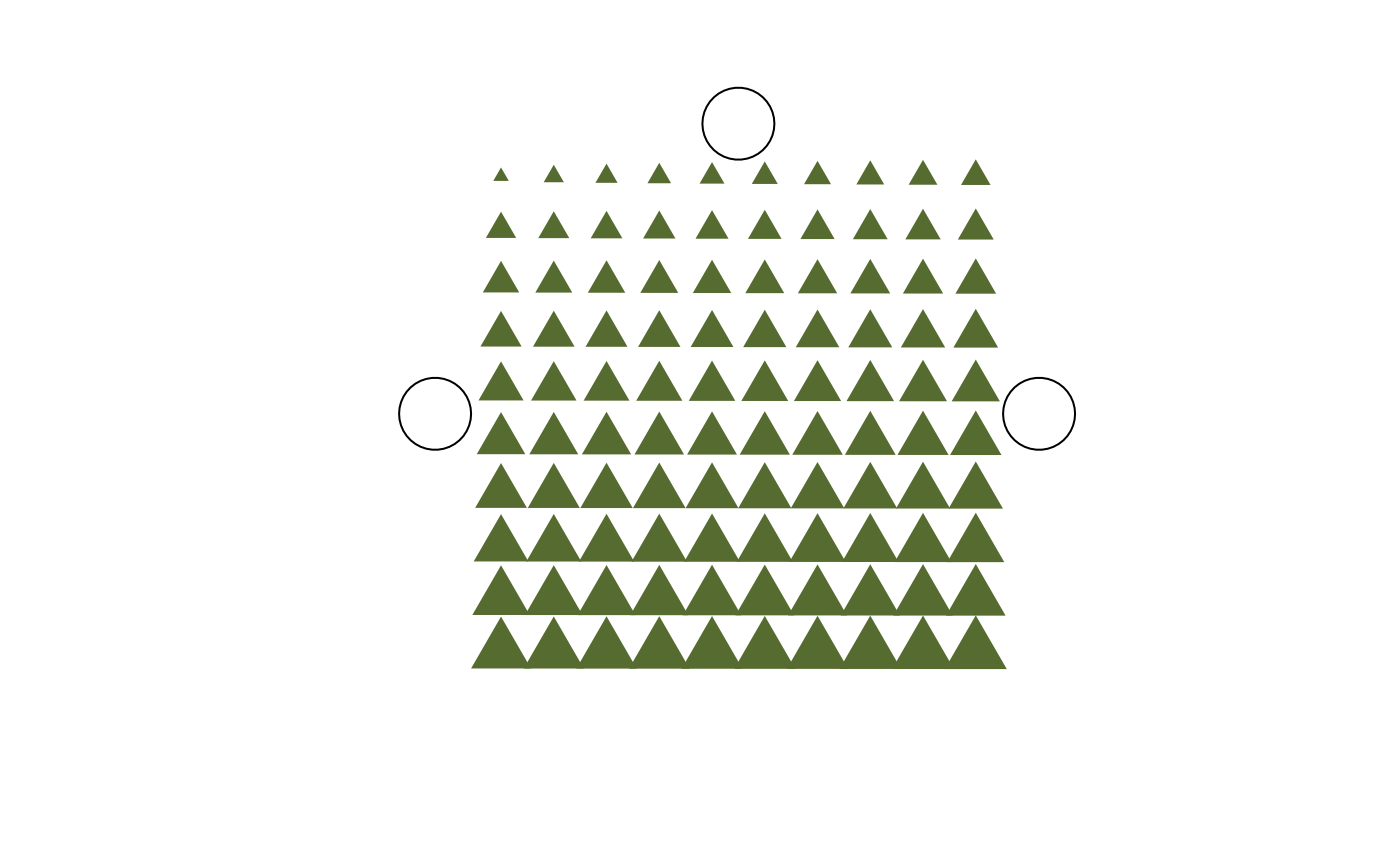
Shows a schematic representation of the physical appearance of one disc (one position in the reader) and illustrates the measured or calculated values per grain location.
Usage
plot_SingleGrainDisc(
  object,
  show_coordinates = FALSE,
  show_location_ids = FALSE,
  show_neighbours = FALSE,
  show_positioning_holes = TRUE,
  df_neighbours = NULL,
  ignore_borders = FALSE,
  str_transform = c("sqrt", "lin", "log"),
  ...
)
Arguments
- object
RLum.Results or numeric (required): the values to show, should have length 100.
- show_coordinates
logical (with default): Show coordinates (1..10) in x and in y direction. Defaults to
FALSE.- show_location_ids
logical (with default): Show id with every grain location (1..100). Defaults to
FALSE.- show_neighbours
logical (with default): Show which neighbour connections are taken into account if calculating Moran's I. This makes sense when there are
NAobservations, or when a non-standard neighbour setting is defined.- show_positioning_holes
logical (with default): Show the 3 positioning holes for orientation. Defaults to
TRUE.- df_neighbours
data.frame (with default): only relevant if
show_neighboursisTRUE. Data frame indicating which borders to consider, and their respective weights (see the description provided for calc_MoransI). IfNULL(default), this is constructed automatically by the internal function.get_Neighbours.- ignore_borders
logical (with default): whether only grain locations that do not lie on the border of the disc should be considered (
FALSEby default). Thus ifTRUE, only the inner 8x8 grain locations rather than the full 10x10 are considered. Ignored ifdf_neighboursis notNULLor ifshow_neighbours = FALSE.- str_transform
character (with default): The observed value of each individual grain is reflected in the size of a triangle (or other dot-like element). To account for large value differences, the transformation from value to triangle size can be
"lin"(linear),"log"(logarithmic) and"sqrt"(square root). Defaults to"sqrt", so that the surface is linear to the value. Note that the log and sqrt transformations can come with an addition to avoid negative values. When the legend is shown, the actual lower, middle and upper values are printed.- ...
other arguments to be given to the base R plot function, such as
main,colandpch.legendcan be used to enable/disable the legend (FALSEby default).
Details
Depending of the available plotting space, some optional elements might have not enough room to be displayed. As this function is wrapped around the base plot function, one can also choose to add elements manually.
How to cite
Boer, A.d., Steinbuch, L., 2026. plot_SingleGrainDisc(): Plot a disc with its values. In: Kreutzer, S., Burow, C., Dietze, M., Fuchs, M.C., Schmidt, C., Fischer, M., Friedrich, J., Mercier, N., Philippe, A., Riedesel, S., Autzen, M., Mittelstrass, D., Gray, H.J., Galharret, J., Colombo, M., Steinbuch, L., Boer, A.d., Bluszcz, A., 2026. Luminescence: Comprehensive Luminescence Dating Data Analysis. R package version 1.2.1. https://r-lum.github.io/Luminescence/
References
de Boer, A-M., Steinbuch, L., Heuvelink, G.B.M., Wallinga, J., 2025. A novel method to assess crosstalk in single-grain luminescence detection. Radiation Measurements 186, 107459. doi:10.1016/j.radmeas.2025.107459