The function analyses IRSAR RF measurements on K-feldspar samples performed using the protocol according to Erfurt et al. (2003) and beyond.
Arguments
- object
RLum.Analysis or a list of RLum.Analysis-objects (required): input object containing data for protocol analysis. The function expects to find at least two curves in the RLum.Analysis object: (1)
RF_nat, (2)RF_reg. If alistis provided as input all other parameters can be provided aslistas well to gain full control.- sequence_structure
vector character (with default): specifies the general sequence structure. Allowed steps are
NATURALandREGENERATED, and at least one of each must appear. In addition, any other character is allowed in the sequence structure; such curves will be ignored during the analysis. Ifsequence_structureis shorter than the number of curves inobject, it is recycled. If multipleNATURALandREGENERATEDsteps are specified, the corresponding measurements are stacked.- RF_nat.lim
vector (with default): set minimum and maximum channel range for natural signal fitting and sliding. If only one value is provided this will be treated as minimum value and the maximum limit will be added automatically.
- RF_reg.lim
vector (with default): set minimum and maximum channel range for regenerated signal fitting and sliding. If only one value is provided this will be treated as minimum value and the maximum limit will be added automatically.
- method
character (with default): select method applied for the data analysis. Possible options are
"FIT","SLIDE","VSLIDE";"NONE"can be used to disable the analysis and plot the natural points at their original position.- method_control
list (optional): parameters to control the method, that can be passed to the chosen method. These are for (1)
method = "FIT":'trace','maxiter','warnOnly','minFactor'and for (2)method = "SLIDE":'correct_onset','show_density','show_fit','trace'. See details.- test_parameters
list (with default): set test parameters. Supported parameters are:
curves_ratio,residuals_slope(only formethod = "SLIDE"and"VSLIDE"),curves_bounds,dynamic_ratio,lambda,betaanddelta.phi. All input: numeric values,NAandNULL(see Details for further information).- n.MC
numeric (with default): number of Monte Carlo runs for the estimation of the start parameter (
method = "FIT") or of the error (method = "SLIDE"and"VSLIDE"). This value can be set toNULLto skip the MC runs. Note: Large values will significantly increase the computation time.- txtProgressBar
logical (with default): enable/disable the progress bar during MC runs.
- plot
logical (with default): enable/disable the plot output.
- plot_reduced
logical (optional): provides a reduced plot output if enabled to allow common R plot combinations, e.g.,
par(mfrow(...)). IfTRUEno residual plot is returned; it has no effect ifplot = FALSE- ...
further arguments that will be passed to the plot output. Currently supported arguments are
main,mtext,xlab,ylab,xlim,ylim,log,legend(TRUE/FALSE),legend.pos,legend.text(passes argument to x,y in graphics::legend),xaxt,verbose(TRUE/FALSE).
Value
The function returns numerical output and an (optional) plot.
———————————–[ NUMERICAL OUTPUT ]
———————————–
RLum.Results-object
slot: @data
[.. $data : data.frame]
| Column | Type | Description |
DE | numeric | the obtained equivalent dose |
DE.ERROR | numeric | (only method = "SLIDE") standard deviation obtained from MC runs |
DE.LOWER | numeric | 2.5% quantile for De values obtained by MC runs |
DE.UPPER | numeric | 97.5% quantile for De values obtained by MC runs |
DE.STATUS | character | test parameter status |
RF_NAT.LIM | character | used RF_nat curve limits |
RF_REG.LIM | character | used RF_reg curve limits |
POSITION | integer | (optional) position of the curves |
DATE | character | (optional) measurement date |
SEQUENCE_NAME | character | (optional) sequence name |
UID | character | unique data set ID |
[.. $De.MC : numeric]
A numeric vector with all the De values obtained by the MC runs.
[.. $test_parameters : data.frame]
| Column | Type | Description |
POSITION | numeric | aliquot position |
PARAMETER | character | test parameter name |
THRESHOLD | numeric | set test parameter threshold value |
VALUE | numeric | the calculated test parameter value (to be compared with the threshold) |
STATUS | character | test parameter status either "OK" or "FAILED" |
SEQUENCE_NAME | character | name of the sequence, so far available |
UID | character | unique data set ID |
[.. $fit : data.frame]
An nls object produced by the fitting.
[.. $slide : list]
A list with data produced during the sliding. Some elements are previously reported with the summary object data. List elements are:
| Element | Type | Description |
De | numeric | the final De obtained with the sliding approach |
De.MC | numeric | all De values obtained by the MC runs |
residuals | numeric | the obtained residuals for each channel of the curve |
trend.fit | lm | fitting results produced by the fitting of the residuals |
RF_nat.slid | matrix | the slid RF_nat curve |
t_n.id | numeric | the index of the t_n offset |
I_n | numeric | the vertical intensity offset if a vertical slide was applied |
algorithm_error | numeric | the vertical sliding suffers from a systematic effect induced by the used algorithm. The returned value is the standard deviation of all obtained De values while expanding the vertical sliding range. It can be added as systematic error to the final De error; so far wanted. |
vslide_range | numeric | the range used for the vertical sliding |
num_slide_windows | integer | the number of windows used for the vertical sliding |
squared_residuals | numeric | the squared residuals (horizontal sliding) |
slot: @info
The original function call (methods::language-object)
The output (data) should be accessed using the function get_RLum.
————————[ PLOT OUTPUT ]
————————
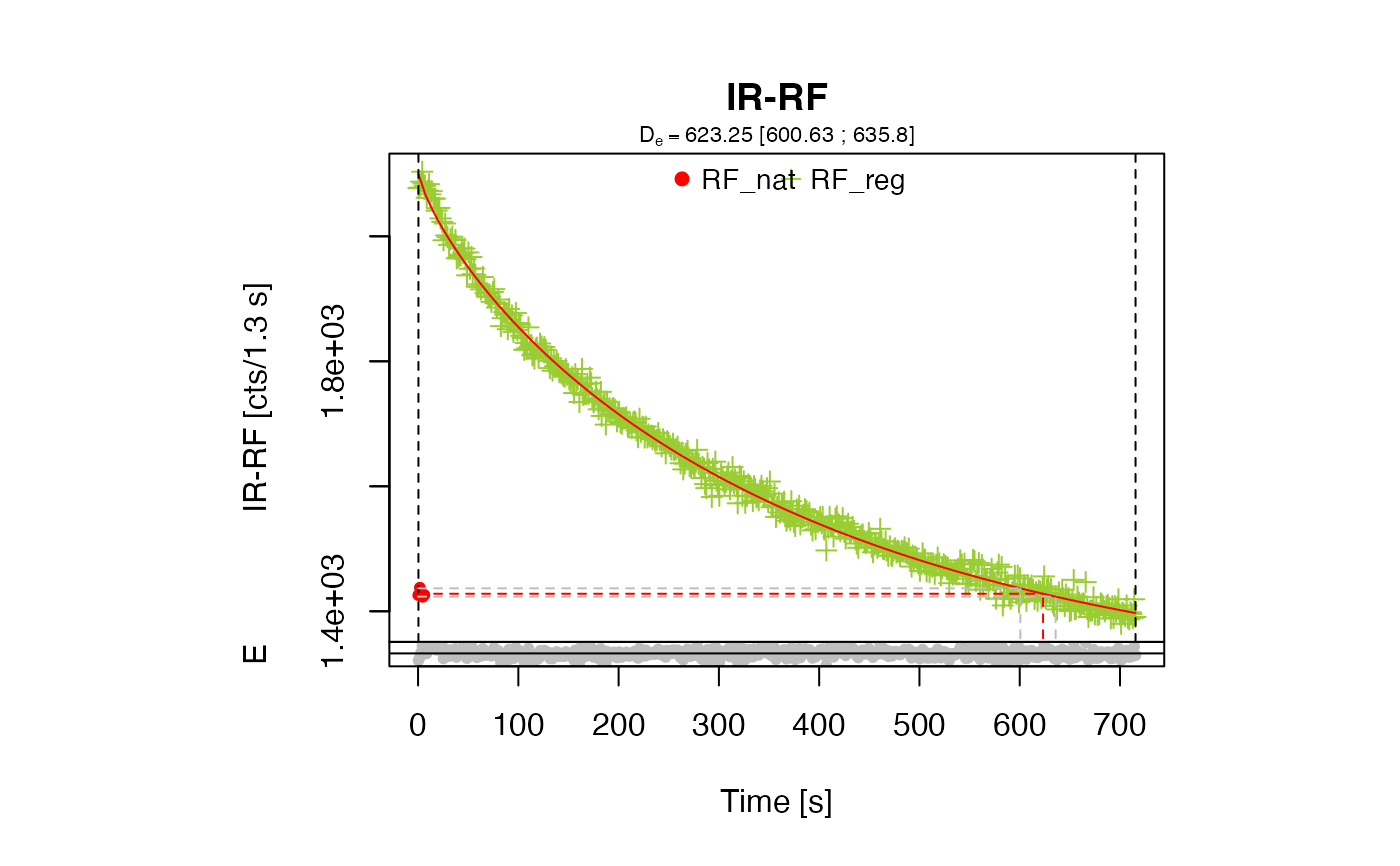
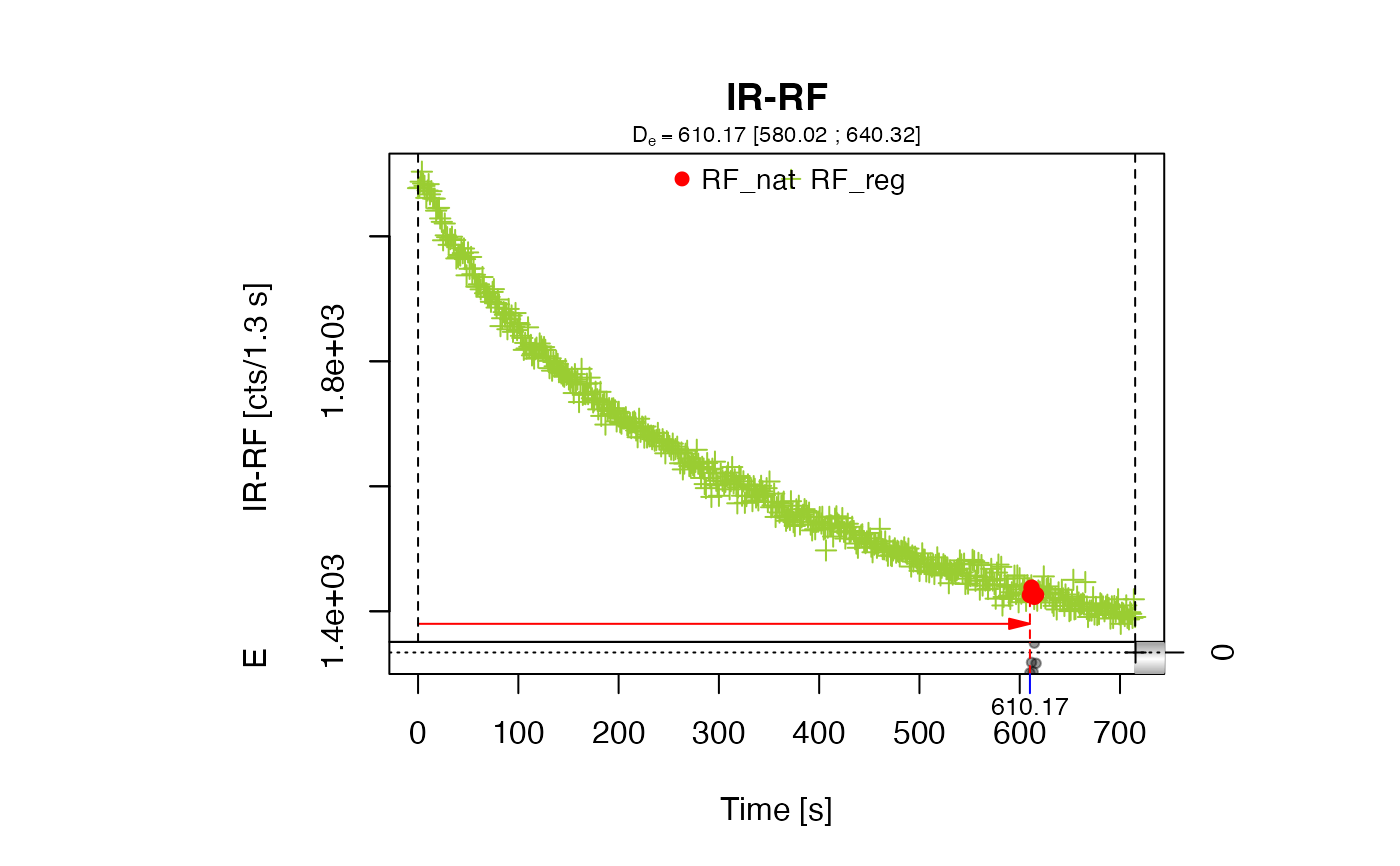
The slid IR-RF curves with the finally obtained De
Details
The function performs an IRSAR analysis described for K-feldspar samples by Erfurt et al. (2003) assuming a negligible sensitivity change of the RF signal.
General Sequence Structure (according to Erfurt et al., 2003)
Measuring IR-RF intensity of the natural dose for a few seconds (\(RF_{nat}\))
Bleach the samples under solar conditions for at least 30 min without changing the geometry
Waiting for at least one hour
Regeneration of the IR-RF signal to at least the natural level (measuring (\(RF_{reg}\))
Fitting data with a stretched exponential function
Calculate the palaeodose \(D_{e}\) using the parameters from the fitting
Three methods are supported to obtain the \(D_{e}\):
method = "FIT", method = "SLIDE" and method = "VSLIDE":
method = "FIT"
The principle is described above and follows the original suggestions by
Erfurt et al., 2003. For the fitting, the mean count value of the RF_nat
curve is used.
Function used for the fitting (according to Erfurt et al. (2003)):
$$\phi(D) = \phi_{0} - \Delta\phi(1 - \exp(-\lambda D))^\beta$$
with \(\phi(D)\) the dose dependent IR-RF flux, \(\phi_{0}\) the initial IR-RF flux, \(\Delta\phi\) the dose dependent change of the IR-RF flux, \(\lambda\) the exponential parameter, \(D\) the dose and \(\beta\) the dispersive factor.
To obtain the palaeodose \(D_{e}\) the function is changed to:
$$D_{e} = \ln(-(\phi(D) - \phi_{0})/(-\lambda\phi)^{1/\beta}+1)/-\lambda$$
The fitting is done using the port algorithm of the nls function.
method = "SLIDE"
For this method, the natural curve is slid along the x-axis until congruence with the regenerated curve is reached. Unlike fitting, this allows for working with the original data without the need for any physical model. This approach was introduced for RF curves by Buylaert et al., 2012 and Lapp et al., 2012.
Here the sliding is done by searching for the minimum of the sum of squared residuals. For the mathematical details of the implementation see Frouin et al., 2017
method = "VSLIDE"
Same as "SLIDE" but searching also vertically for the best match (i.e. in xy-direction.)
See Kreutzer et al. (2017) and Murari et al. (2021). By default, the vertical sliding
range is set automatically, but can be set manually by changing the
vslide_range parameter (see method_control).
method_control
To keep the generic argument list as clear as possible, parameters to control
the methods for De estimation are preset with meaningful default values,
which can however be modified using the method_control argument, e.g.,
method_control = list(trace = TRUE). Supported parameters are:
For FIT
For SLIDE or VSLIDE
trace(logical, default:FALSE): as in nls; shows sum of squared residuals.trace_vslide(logical, default:FALSE): enable/disable the tracing of the vertical sliding.correct_onset(logical, default:TRUE): whether the curves should be shifted along the x-axis by the first channel, as light is expected in the first channel.show_density(logical, default:TRUE): enable/disable KDE plots for MC run results. Nothing is shown if the distribution is too narrow.show_fit(logical, default:FALSE): enable/disable the plot of the fitted curve routinely obtained during the evaluation.n.MC(integer, default: 1000): number of Monte Carlo runs within the sliding (assessing the possible minimum values). Note: This parameter is not the same as the function argumentn.MC.vslide_range(numeric or character, default: "auto"): boundaries for the vertical curve sliding. The argument expects a vector with absolute minimum and maximum (e.g.,c(-1000,1000)). The default "auto" mode detects the reasonable vertical sliding range (recommended).NULLdisables the vertical sliding.num_slide_windows(integer, default: 3): number of differently-sized windows tested when sliding: the higher the value (up to a maximum of 10), the more time is spent in searching the global optimum. The default setting attempts to strike a balance between quality of the fit and computation speed.cores(numeric or character, default:NULL): number of cores allocated for a parallel processing of the Monte-Carlo runs. The default value corresponds to single-threaded computation; the recommended values is"auto", which assigns all but two of the available cores.
Error estimation
For method = "FIT", the \(D_{e}\) error range is obtained by using
the 2.5 % (lower) and the 97.5 % (upper) quantiles of the \(RF_{nat}\)
curve.
For method = "SLIDE" and method = "VSLIDE", the error is obtained
by bootstrapping the residuals of the slid curve to construct new natural
curves for a Monte Carlo simulation. The error is returned in two ways:
(a) the standard deviation of the \(D_{e}\) obtained from the MC runs and
(b) the confidence interval using the 2.5 % (lower) and the 97.5 % (upper)
quantiles. The results of the MC runs are returned with the function output.
Test parameters
The argument test_parameters allows to pass thresholds for several test
parameters, which will be evaluated during the function run. If a threshold
is set and it is exceeded, the test parameter status will be set to
"FAILED". This argument is intentionally not termed 'rejection criteria'
as not all test parameters are evaluated for both methods and some parameters
are calculated but not evaluated by default.
NA and NULL are the allowed values for all parameters. If the parameter
is set to NA, the value is calculated but the result will not be evaluated,
therefore it will have no effect on the status ("OK" or "FAILED") of
the parameter. Setting the parameter to NULL disables the parameter
entirely and the parameter will also be removed from the function output.
This might be useful in cases where a particular parameter requires a long
computation time. Currently supported parameters are:
curves_ratio(numeric, default:1.001): the ratio of \(RF_{nat}\) to \(RF_{reg}\) is calculated over the range spanned by \(RF_{nat}\), and should not exceed the threshold value.intersection_ratio(numeric, default:NA): calculated as absolute difference from 1 of the ratio of the integral of the normalised RF-curves. This value indicates intersection of the RF-curves and should be close to 0 if the curves have a similar shape. For this calculation first the corresponding time-count pair value on the RF_reg curve is obtained using the maximum count value of theRF_natcurve and only this segment (fitting to theRF_natcurve) on the RF_reg curve is taken for further calculating this ratio. If nothing is found at all,Infis returned.residuals_slope(numeric, default:NA; only formethod = "SLIDE"and"VSLIDE"): a linear function is fitted on the residuals after sliding. The corresponding slope can be used to discard values as a high (positive, negative) slope may indicate that both curves are fundamentally different and the method cannot be applied at all. By default, the value of this parameter is calculated but not evaluated.curves_bounds(numeric, default: \(\max(RF_{reg_counts})\)): this measure uses the maximum time (x) value of the regenerated curve. The maximum time (x) value of the natural curve cannot be larger than this value. However, although this is not recommended the value can be changed or disabled.dynamic_ratio(numeric, default:NA): the dynamic ratio of the regenerated curve is calculated as ratio of the minimum and maximum count values.lambda,betaanddelta.phinumeric (default:NA): the stretched exponential function suggested by Erfurt et al. (2003) describing the decay of the RF signal, comprises several parameters that might be useful to evaluate the shape of the curves. Formethod = "FIT", this parameter is obtained during the fitting; formethod = "SLIDE"a rather rough estimation is made using the function minpack.lm::nlsLM and the equation given above. Note: As this procedure requests more computation time, it is performed only if all three parameters are set.
Note
This function assumes that there is no sensitivity change during the measurements (natural vs. regenerated signal), which is in contrast to the findings by Buylaert et al. (2012).
How to cite
Kreutzer, S., 2026. analyse_IRSAR.RF(): Analyse IRSAR RF measurements. Function version 0.7.10. In: Kreutzer, S., Burow, C., Dietze, M., Fuchs, M.C., Schmidt, C., Fischer, M., Friedrich, J., Mercier, N., Philippe, A., Riedesel, S., Autzen, M., Mittelstrass, D., Gray, H.J., Galharret, J., Colombo, M., Steinbuch, L., Boer, A.d., Bluszcz, A., 2026. Luminescence: Comprehensive Luminescence Dating Data Analysis. R package version 1.2.1. https://r-lum.github.io/Luminescence/
References
Buylaert, J.P., Jain, M., Murray, A.S., Thomsen, K.J., Lapp, T., 2012. IR-RF dating of sand-sized K-feldspar extracts: A test of accuracy. Radiation Measurements 44 (5-6), 560-565. doi:10.1016/j.radmeas.2012.06.021
Erfurt, G., Krbetschek, M.R., 2003. IRSAR - A single-aliquot regenerative-dose dating protocol applied to the infrared radiofluorescence (IR-RF) of coarse- grain K-feldspar. Ancient TL 21, 35-42. doi:10.26034/la.atl.2003.358
Erfurt, G., 2003. Infrared luminescence of Pb+ centres in potassium-rich feldspars. physica status solidi (a) 200, 429-438. doi:10.1002/pssa.200306700
Erfurt, G., Krbetschek, M.R., 2003. Studies on the physics of the infrared radioluminescence of potassium feldspar and on the methodology of its application to sediment dating. Radiation Measurements 37, 505-510. doi:10.1016/s1350-4487(03)00058-1
Erfurt, G., Krbetschek, M.R., Bortolot, V.J., Preusser, F., 2003. A fully automated multi-spectral radioluminescence reading system for geochronometry and dosimetry. Nuclear Instruments and Methods in Physics Research Section B: Beam Interactions with Materials and Atoms 207, 487-499. doi:10.1016/s0168-583x(03)01121-2
Frouin, M., Huot, S., Kreutzer, S., Lahaye, C., Lamothe, M., Philippe, A., Mercier, N., 2017. An improved radiofluorescence single-aliquot regenerative dose protocol for K-feldspars. Quaternary Geochronology 38, 13-24. doi:10.1016/j.quageo.2016.11.004
Kreutzer, S., Murari, M.K., Frouin, M., Fuchs, M., Mercier, N., 2017. Always remain suspicious: a case study on tracking down a technical artefact while measuring IR-RF. Ancient TL 35, 20–30. doi:10.26034/la.atl.2017.510
Murari, M.K., Kreutzer, S., Fuchs, M., 2018. Further investigations on IR-RF: Dose recovery and correction. Radiation Measurements 120, 110–119. doi: 10.1016/j.radmeas.2018.04.017 doi:10.1016/j.radmeas.2018.04.017
Lapp, T., Jain, M., Thomsen, K.J., Murray, A.S., Buylaert, J.P., 2012. New luminescence measurement facilities in retrospective dosimetry. Radiation Measurements 47, 803-808. doi:10.1016/j.radmeas.2012.02.006
Trautmann, T., 2000. A study of radioluminescence kinetics of natural feldspar dosimeters: experiments and simulations. Journal of Physics D: Applied Physics 33, 2304-2310. doi:10.1088/0022-3727/33/18/315
Trautmann, T., Krbetschek, M.R., Dietrich, A., Stolz, W., 1998. Investigations of feldspar radioluminescence: potential for a new dating technique. Radiation Measurements 29, 421-425. doi:10.1016/s1350-4487(98)00012-2
Trautmann, T., Krbetschek, M.R., Dietrich, A., Stolz, W., 1999. Feldspar radioluminescence: a new dating method and its physical background. Journal of Luminescence 85, 45-58. doi:10.1016/s0022-2313(99)00152-0
Trautmann, T., Krbetschek, M.R., Stolz, W., 2000. A systematic study of the radioluminescence properties of single feldspar grains. Radiation Measurements 32, 685-690. doi:10.1016/s1350-4487(00)00077-9
** Further reading**
Murari, M.K., Kreutzer, S., King, G.E., Frouin, M., Tsukamoto, S., Schmidt, C., Lauer, T., Klasen, N., Richter, D., Friedrich, J., Mercier, N., Fuchs, M., 2021. Infrared radiofluorescence (IR-RF) dating: A review. Quaternary Geochronology 64, 101155. doi:10.1016/j.quageo.2021.101155
Author
Sebastian Kreutzer, F2.1 Geophysical Parametrisation/Regionalisation, LIAG - Institute for Applied Geophysics (Germany) , RLum Developer Team
Examples
##load data
data(ExampleData.RLum.Analysis, envir = environment())
##(1) perform analysis using the method 'FIT'
results <- analyse_IRSAR.RF(object = IRSAR.RF.Data)
 ##show De results and test parameter results
get_RLum(results, data.object = "data")
#> DE DE.ERROR DE.LOWER DE.UPPER DE.STATUS RF_NAT.LIM RF_REG.LIM POSITION
#> 1 623.25 NA 600.63 635.8 OK 1:5 1:524 NA
#> DATE SEQUENCE_NAME UID
#> 1 NA NA 93e8ace04c18defe
get_RLum(results, data.object = "test_parameters")
#> POSITION PARAMETER THRESHOLD VALUE STATUS SEQUENCE_NAME
#> 1 NA curves_ratio 1.001 6.845685e-01 OK NA
#> 2 NA intersection_ratio NA 5.541736e-03 OK NA
#> 3 NA residuals_slope NA NA OK NA
#> 4 NA curves_bounds 716.000 6.358000e+02 OK NA
#> 5 NA dynamic_ratio NA 1.524261e+00 OK NA
#> 6 NA lambda NA 2.182234e-04 OK NA
#> 7 NA beta NA 5.418718e-01 OK NA
#> 8 NA delta.phi NA 2.103400e+03 OK NA
#> UID
#> 1 93e8ace04c18defe
#> 2 93e8ace04c18defe
#> 3 93e8ace04c18defe
#> 4 93e8ace04c18defe
#> 5 93e8ace04c18defe
#> 6 93e8ace04c18defe
#> 7 93e8ace04c18defe
#> 8 93e8ace04c18defe
##(2) perform analysis using the method 'SLIDE'
data(ExampleData.RF70Curves, envir = environment())
results <- analyse_IRSAR.RF(
object = RF70Curves,
method = "SLIDE",
n.MC = 1)
#>
#> Run Monte Carlo loops for error estimation
#>
|
| | 0%
|
|======================================================================| 100%
#> Warning: [analyse_IRSAR.RF()] Narrow density distribution, no density distribution plotted
##show De results and test parameter results
get_RLum(results, data.object = "data")
#> DE DE.ERROR DE.LOWER DE.UPPER DE.STATUS RF_NAT.LIM RF_REG.LIM POSITION
#> 1 623.25 NA 600.63 635.8 OK 1:5 1:524 NA
#> DATE SEQUENCE_NAME UID
#> 1 NA NA 93e8ace04c18defe
get_RLum(results, data.object = "test_parameters")
#> POSITION PARAMETER THRESHOLD VALUE STATUS SEQUENCE_NAME
#> 1 NA curves_ratio 1.001 6.845685e-01 OK NA
#> 2 NA intersection_ratio NA 5.541736e-03 OK NA
#> 3 NA residuals_slope NA NA OK NA
#> 4 NA curves_bounds 716.000 6.358000e+02 OK NA
#> 5 NA dynamic_ratio NA 1.524261e+00 OK NA
#> 6 NA lambda NA 2.182234e-04 OK NA
#> 7 NA beta NA 5.418718e-01 OK NA
#> 8 NA delta.phi NA 2.103400e+03 OK NA
#> UID
#> 1 93e8ace04c18defe
#> 2 93e8ace04c18defe
#> 3 93e8ace04c18defe
#> 4 93e8ace04c18defe
#> 5 93e8ace04c18defe
#> 6 93e8ace04c18defe
#> 7 93e8ace04c18defe
#> 8 93e8ace04c18defe
##(2) perform analysis using the method 'SLIDE'
data(ExampleData.RF70Curves, envir = environment())
results <- analyse_IRSAR.RF(
object = RF70Curves,
method = "SLIDE",
n.MC = 1)
#>
#> Run Monte Carlo loops for error estimation
#>
|
| | 0%
|
|======================================================================| 100%
#> Warning: [analyse_IRSAR.RF()] Narrow density distribution, no density distribution plotted
 if (FALSE) { # \dontrun{
##(3) perform analysis using the method 'VSLIDE' and method control option
## 'trace
results <- analyse_IRSAR.RF(
object = RF70Curves,
method = "VSLIDE",
method_control = list(trace = TRUE))
} # }
if (FALSE) { # \dontrun{
##(3) perform analysis using the method 'VSLIDE' and method control option
## 'trace
results <- analyse_IRSAR.RF(
object = RF70Curves,
method = "VSLIDE",
method_control = list(trace = TRUE))
} # }