Calculation of the source dose rate via the date of measurement
Source:R/calc_SourceDoseRate.R
calc_SourceDoseRate.RdCalculating the dose rate of the irradiation source via the date of measurement based on: source calibration date, source dose rate, dose rate error. The function returns a data.frame that provides the input argument dose_rate for the function convert_Second2Gray.
Calculation of the source dose rate based on the time elapsed since the last calibration of the irradiation source. Decay parameters assume a Sr-90 beta source. $$dose.rate = D0 \exp(-\frac{\log(2)}{T.1/2} t)$$
where D0 is the calibration dose rate, \(T.1/2\) is the half-life of the
source nuclide (in days), t is the time since source calibration (in days),
and \(\log(2) / T.1/2\) equals the decay constant lambda.
Information on the date of measurements may be taken from the data's
original .BIN file (using e.g., BINfile <- Luminescence::read_BIN2R() and the slot
BINfile@METADATA$DATE).
Allowed source types and related values
| # | Source type | T.1/2 | Reference |
[1] | Sr-90 | 28.90 y | NNDC, Brookhaven National Laboratory |
[2] | Am-214 | 432.6 y | NNDC, Brookhaven National Laboratory |
[3] | Co-60 | 5.274 y | NNDC, Brookhaven National Laboratory |
[4] | Cs-137 | 30.08 y | NNDC, Brookhaven National Laboratory |
Arguments
- measurement.date
character or Date (with default): Date of measurement in
"YYYY-MM-DD"format. If no value is provided, the date will be set to today. The argument can be provided as vector.- calib.date
character or Date (required): date of source calibration in
"YYYY-MM-DD"format.- calib.dose.rate
numeric (required): dose rate at date of calibration in Gy/s or Gy/min.
- calib.error
numeric (required): error of dose rate at date of calibration Gy/s or Gy/min.
- source.type
character (with default): specify irradiation source (
Sr-90,Co-60,Cs-137,Am-214), see details for further information.- dose.rate.unit
character (with default): dose rate unit for input (one of
Gy/minorGy/s). The output is given in Gy/s as valid for the function convert_Second2Gray.- predict
integer (with default): option allowing to predict the dose rate of the source over time in days set by the provided value. Starting date is the value set with
measurement.date, e.g.,calc_SourceDoseRate(..., predict = 100)calculates the source dose rate for the next 100 days.
Value
Returns an S4 object of type RLum.Results.
Slot data contains a list with the following structure:
$ dose.rate (data.frame)
.. $ dose.rate
.. $ dose.rate.error
.. $ date (corresponding measurement date)
$ parameters (list)
.. $ source.type
.. $ halflife
.. $ dose.rate.unit
$ call (the original function call)
The output should be accessed using the function get_RLum. A plot method of the output is provided via plot_RLum.
Note
Please be careful when using the option predict, especially when a
multiple set for measurement.date and calib.date is provided. For the
source dose rate prediction, the function takes the last measurement.date
value and predicts from that the source dose rate for the number of days
requested, that is: the (multiple) original input will be replaced.
However, the function does not change entries for the calibration dates,
but mixes them up. Therefore, it is not recommended to use this option
when multiple calibration dates (calib.date) are provided.
How to cite
Fuchs, M.C., Kreutzer, S., 2026. calc_SourceDoseRate(): Calculation of the source dose rate via the date of measurement. Function version 0.3.4. In: Kreutzer, S., Burow, C., Dietze, M., Fuchs, M.C., Schmidt, C., Fischer, M., Friedrich, J., Mercier, N., Philippe, A., Riedesel, S., Autzen, M., Mittelstrass, D., Gray, H.J., Galharret, J., Colombo, M., Steinbuch, L., Boer, A.d., Bluszcz, A., 2026. Luminescence: Comprehensive Luminescence Dating Data Analysis. R package version 1.2.1. https://r-lum.github.io/Luminescence/
Author
Margret C. Fuchs, HZDR, Helmholtz-Institute Freiberg for Resource Technology (Germany)
Sebastian Kreutzer, F2.1 Geophysical Parametrisation/Regionalisation, LIAG - Institute for Applied Geophysics (Germany)
, RLum Developer Team
Examples
##(1) Simple function usage
##Basic calculation of the dose rate for a specific date
dose.rate <- calc_SourceDoseRate(measurement.date = "2012-01-27",
calib.date = "2014-12-19",
calib.dose.rate = 0.0438,
calib.error = 0.0019)
##show results
get_RLum(dose.rate)
#> dose.rate dose.rate.error date
#> 1 0.04694815 0.002036563 2012-01-27
##(2) Usage in combination with another function (e.g., convert_Second2Gray() )
## load example data
data(ExampleData.DeValues, envir = environment())
## use the calculated variable dose.rate as input argument
## to convert De(s) to De(Gy)
convert_Second2Gray(ExampleData.DeValues$BT998, dose.rate)
#> De De.error
#> 1 162.37 5.717
#> 2 163.01 5.514
#> 3 177.72 7.294
#> 4 145.93 4.939
#> 5 154.80 4.976
#> 6 132.31 4.792
#> 7 132.53 4.531
#> 8 136.21 4.712
#> 9 134.04 4.962
#> 10 133.39 4.561
#> 11 127.12 4.340
#> 12 137.29 4.724
#> 13 118.74 3.967
#> 14 129.71 4.488
#> 15 133.01 4.426
#> 16 133.66 4.334
#> 17 132.57 4.568
#> 18 135.42 4.531
#> 19 137.83 4.560
#> 20 140.91 4.768
#> 21 136.96 4.641
#> 22 140.47 5.384
#> 23 135.42 4.628
#> 24 123.79 3.729
#> 25 128.18 4.090
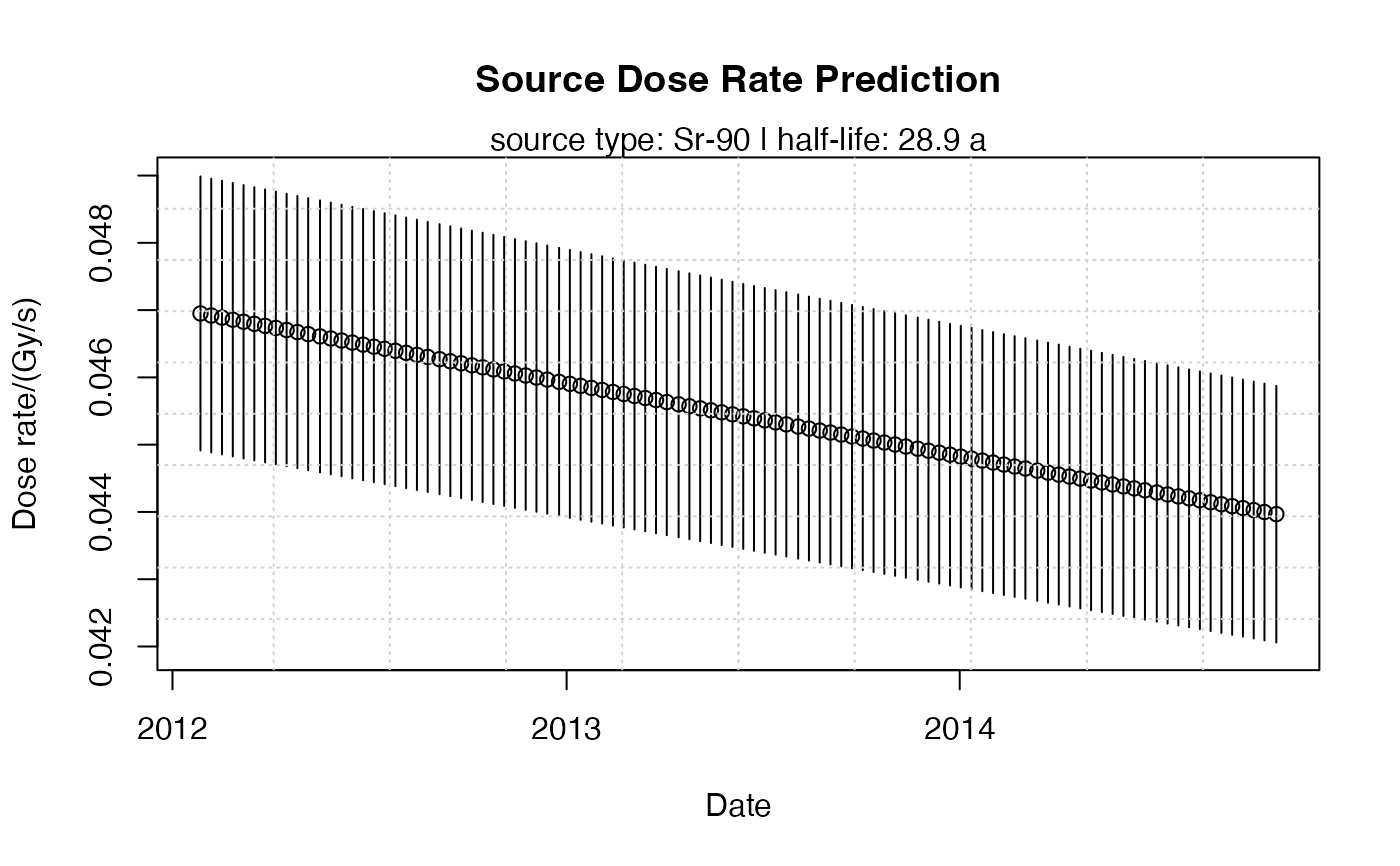
##(3) source rate prediction and plotting
dose.rate <- calc_SourceDoseRate(measurement.date = "2012-01-27",
calib.date = "2014-12-19",
calib.dose.rate = 0.0438,
calib.error = 0.0019,
predict = 1000)
plot_RLum(dose.rate)
 ##(4) export output to a LaTeX table (example using the package 'xtable')
if (FALSE) { # \dontrun{
xtable::xtable(get_RLum(dose.rate))
} # }
##(4) export output to a LaTeX table (example using the package 'xtable')
if (FALSE) { # \dontrun{
xtable::xtable(get_RLum(dose.rate))
} # }