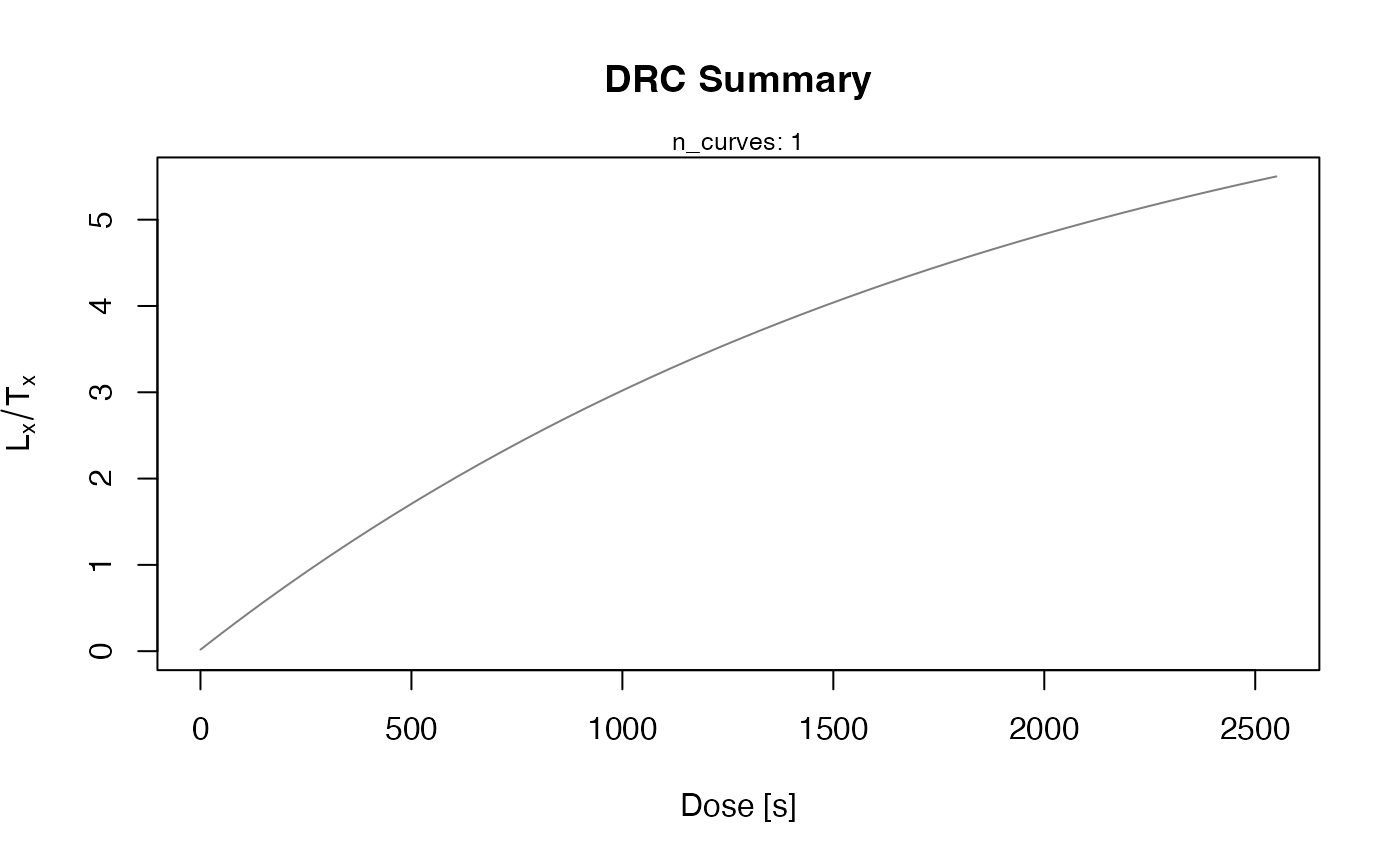
While analysing OSL SAR or pIRIR-data the view on the data is usually limited to one dose-response curve (DRC) at the time for one aliquot. This function overcomes this limitation by plotting all DRCs from an RLum.Results object created by analyse_SAR.CWOSL in one single plot.
If you want plot your DRC on an energy scale (dose in Gy), you can either
use option source_dose_rate or perform your SAR analysis with the dose
points in Gy (better axis scaling).
Usage
plot_DRCSummary(
  object,
  source_dose_rate = NULL,
  sel_curves = NULL,
  show_dose_points = FALSE,
  show_natural = FALSE,
  n = 51L,
  ...
)
Arguments
- object
RLum.Results (required): input object created by analyse_SAR.CWOSL. The input object can be provided as list.
- source_dose_rate
numeric (optional): allows to modify the axis and show values in Gy, instead seconds. Only a single numerical value is allowed.
- sel_curves
numeric (optional): id of the curves to be plotted in its occurring order. A sequence can be provided for selecting, e.g., only every 2nd curve from the input object.
- show_dose_points
logical (with default): enable/disable plotting of dose points in the graph.
- show_natural
logical (with default): enable/disable the plot of the natural
Lx/Txvalues.- n
integer (with default): number of x-values used to evaluate one curve object. Large numbers slow down the plotting process and are usually not needed.
- ...
Further arguments and graphical parameters to be passed. In particular:
main,xlab,ylab,xlim,ylim,lty,lwd,pch,col.pch,col.lty,mtext
Value
An RLum.Results object is returned:
Slot: @data
| OBJECT | TYPE | COMMENT |
results | data.frame | with dose and LxTx values |
data | RLum.Results | original input data |
Slot: @info
| OBJECT | TYPE | COMMENT |
call | call | the original function call |
args | list | arguments of the original function call |
Note: If the input object is a list a list of RLum.Results objects is returned.
Author
Sebastian Kreutzer, Institute of Geography, Heidelberg University (Germany)
Christoph Burow, University of Cologne (Germany)
, RLum Developer Team
How to cite
Kreutzer, S., Burow, C., 2025. plot_DRCSummary(): Create a Dose-Response Curve Summary Plot. Function version 0.2.4. In: Kreutzer, S., Burow, C., Dietze, M., Fuchs, M.C., Schmidt, C., Fischer, M., Friedrich, J., Mercier, N., Philippe, A., Riedesel, S., Autzen, M., Mittelstrass, D., Gray, H.J., Galharret, J., Colombo, M., Steinbuch, L., Boer, A.d., 2025. Luminescence: Comprehensive Luminescence Dating Data Analysis. R package version 1.1.2. https://r-lum.github.io/Luminescence/
Examples
#load data example data
data(ExampleData.BINfileData, envir = environment())

#transform the values from the first position in a RLum.Analysis object
object <- Risoe.BINfileData2RLum.Analysis(CWOSL.SAR.Data, pos=1)

results <- analyse_SAR.CWOSL(
  object = object,
  signal.integral.min = 1,
  signal.integral.max = 2,
   background.integral.min = 900,
   background.integral.max = 1000,
   plot = FALSE
 )
#> [fit_DoseResponseCurve()] Fit: EXP (interpolation) | De = 1668.25 | D01 = 1982.76

##plot only DRC
plot_DRCSummary(results)

#>
#>  [RLum.Results-class]
#> 	 originator: plot_DRCSummary()
#> 	 data: 2
#>  	 .. $results : data.frame
#> 	 .. $data : RLum.Results
#> 	 additional info elements:  2
#>
#> [RLum.Results-class]
#> originator: plot_DRCSummary()
#> data: 2
#> .. $results : data.frame
#> .. $data : RLum.Results
#> additional info elements: 2