Plot function for an RLum.Results S4 class object
Source:R/plot_RLum.Results.R
plot_RLum.Results.RdThe function provides a standardised plot output for data of an RLum.Results S4 class object
Arguments
- object
RLum.Results (required): S4 object of class
RLum.Results- single
logical (with default): single plot output (
TRUE/FALSE) to allow for plotting the results in as few plot windows as possible.- ...
further arguments and graphical parameters will be passed to the
plotfunction.
Details
The function produces a multiple plot output. A file output is recommended (e.g., pdf).
Note
Not all arguments available for plot will be passed!
Only plotting of RLum.Results objects are supported.
Author
Christoph Burow, University of Cologne (Germany)
Sebastian Kreutzer, F2.1 Geophysical Parametrisation/Regionalisation, LIAG - Institute for Applied Geophysics (Germany)
, RLum Developer Team
How to cite
Burow, C., Kreutzer, S., 2026. plot_RLum.Results(): Plot function for an RLum.Results S4 class object. Function version 0.2.1. In: Kreutzer, S., Burow, C., Dietze, M., Fuchs, M.C., Schmidt, C., Fischer, M., Friedrich, J., Mercier, N., Philippe, A., Riedesel, S., Autzen, M., Mittelstrass, D., Gray, H.J., Galharret, J., Colombo, M., Steinbuch, L., Boer, A.d., Bluszcz, A., 2026. Luminescence: Comprehensive Luminescence Dating Data Analysis. R package version 1.2.1. https://r-lum.github.io/Luminescence/
Examples
###load data
data(ExampleData.DeValues, envir = environment())
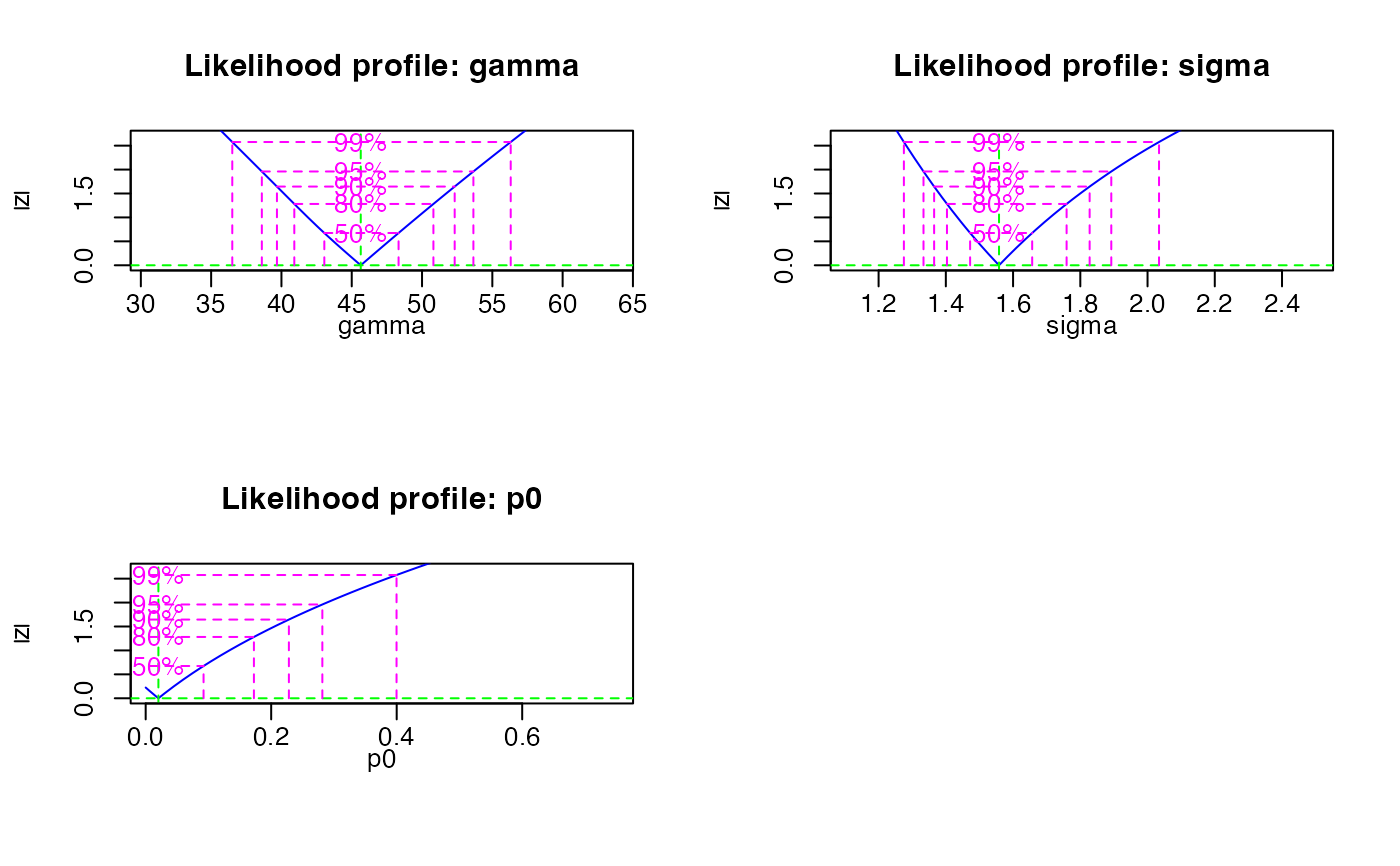
# apply the un-logged minimum age model
mam <- calc_MinDose(data = ExampleData.DeValues$CA1, sigmab = 0.2, log = TRUE, plot = FALSE)
#>
#> ----------- Meta data -----------
#> n par sigmab logged Lmax BIC
#> 62 3 0.2 TRUE -32.43138 84.14389
#>
#> --- Final parameter estimates ---
#> gamma sigma p0
#> Estimate 45.64 1.56 0.02
#>
#> ------ Confidence intervals -----
#> 2.5 % 97.5 %
#> gamma 38.61 53.65
#> sigma 1.33 1.89
#> p0 NA 0.28
#>
#> ------ De (asymmetric error) -----
#> De lower upper
#> 45.64 38.61 53.65
#>
#> ------ De (symmetric error) -----
#> De error
#> 45.64 3.84
##plot
plot_RLum.Results(mam)
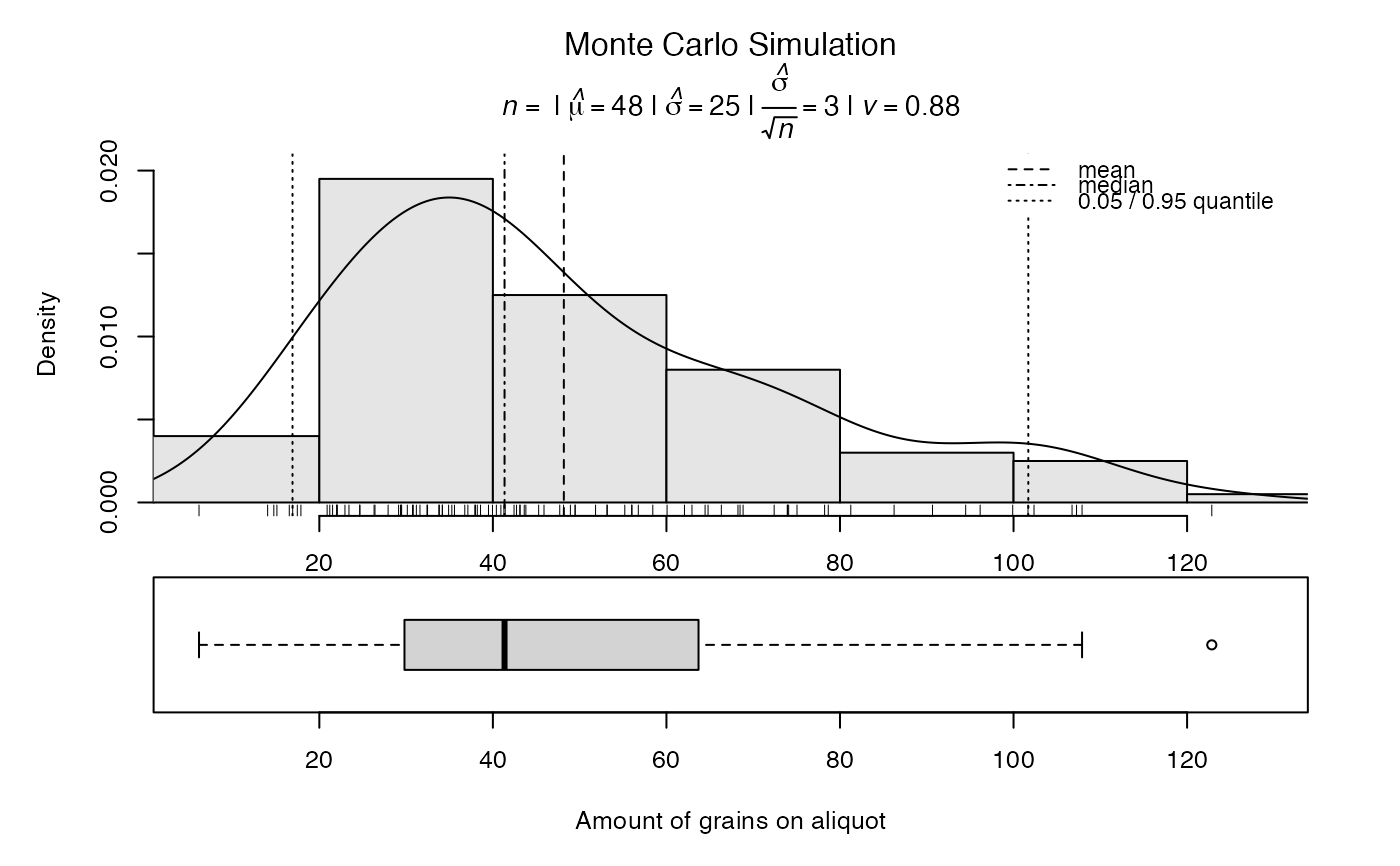
 # estimate the number of grains on an aliquot
grains<- calc_AliquotSize(grain.size = c(100,150), sample.diameter = 1, plot = FALSE, MC.iter = 100)
#>
#> [calc_AliquotSize]
#>
#> ---------------------------------------------------------
#> mean grain size (microns) : 125
#> sample diameter (mm) : 1
#> packing density : 0.65
#> number of grains : 42
#>
#> --------------- Monte Carlo Estimates -------------------
#> number of iterations (n) : 100
#> median : 41
#> mean : 48
#> standard deviation (mean) : 25
#> standard error (mean) : 2.5
#> 95% CI from t-test (mean) : 43 - 53
#> standard error from CI (mean): 2.6
#> ---------------------------------------------------------
##plot
plot_RLum.Results(grains)
# estimate the number of grains on an aliquot
grains<- calc_AliquotSize(grain.size = c(100,150), sample.diameter = 1, plot = FALSE, MC.iter = 100)
#>
#> [calc_AliquotSize]
#>
#> ---------------------------------------------------------
#> mean grain size (microns) : 125
#> sample diameter (mm) : 1
#> packing density : 0.65
#> number of grains : 42
#>
#> --------------- Monte Carlo Estimates -------------------
#> number of iterations (n) : 100
#> median : 41
#> mean : 48
#> standard deviation (mean) : 25
#> standard error (mean) : 2.5
#> 95% CI from t-test (mean) : 43 - 53
#> standard error from CI (mean): 2.6
#> ---------------------------------------------------------
##plot
plot_RLum.Results(grains)