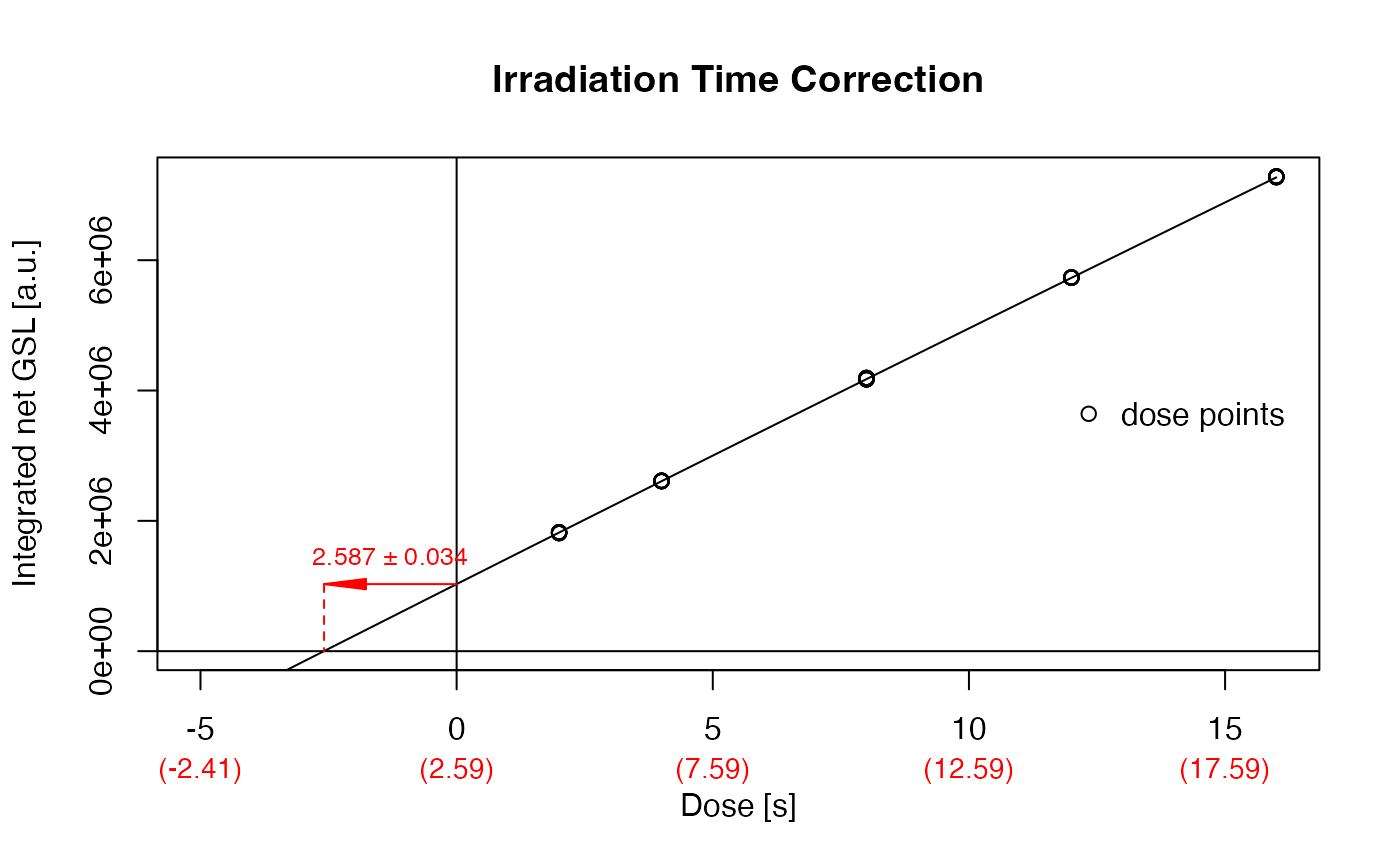
The function provides a very particular analysis to correct the irradiation time while irradiating Al2O3:C chips in a luminescence reader.
Usage
analyse_Al2O3C_ITC(
  object,
  signal_integral = NULL,
  dose_points = c(2, 4, 8, 12, 16),
  recordType = "OSL (UVVIS)",
  method_control = NULL,
  verbose = TRUE,
  plot = TRUE,
  ...
)
Arguments
- object
RLum.Analysis or list (required): results obtained from the measurement. Alternatively a list of RLum.Analysis objects can be provided to allow an automatic analysis
- signal_integral
numeric (optional): signal integral, used for the signal and the background. If nothing is provided the full range is used. Argument can be provided as list.
- dose_points
numeric (with default): vector with dose points, if dose points are repeated, only the general pattern needs to be provided. Default values follow the suggestions made by Kreutzer et al., 2018. Argument can be provided as list.
- recordType
character (with default): input curve selection, which is passed to function get_RLum. To deactivate the automatic selection set the argument to
NULL- method_control
list (optional): optional parameters to control the calculation. See details for further explanations
- verbose
logical (with default): enable/disable output to the terminal.
- plot
logical (with default): enable/disable the plot output.
- ...
further arguments that can be passed to the plot output
Value
Function returns results numerically and graphically:
———————————–[ NUMERICAL OUTPUT ]
———————————–
RLum.Results-object
slot: @data
| Element | Type | Description |
$data | data.frame | correction value and error |
$table | data.frame | table used for plotting |
$table_mean | data.frame | table used for fitting |
$fit | lm or nls | the fitting as returned by the function fit_DoseResponseCurve |
slot: @info
The original function call
————————[ PLOT OUTPUT ]
————————
A dose response curve with the marked correction values
Details
Background: Due to their high dose sensitivity Al2O3:C chips are usually irradiated for only a very short duration or under the closed beta-source within a luminescence reader. However, due to its high dose sensitivity, during the movement towards the beta-source, the pellet already receives and non-negligible dose. Based on measurements following a protocol suggested by Kreutzer et al., 2018, a dose response curve is constructed and the intersection (absolute value) with the time axis is taken as real irradiation time.
method_control
To keep the generic argument list as clear as possible, arguments to allow a
deeper control of the method are all preset with meaningful default parameters and can be
handled using the argument method_control only, e.g.,
method_control = list(fit.method = "LIN"). Supported arguments are:
| ARGUMENT | FUNCTION | DESCRIPTION |
mode | fit_DoseResponseCurve | as in fit_DoseResponseCurve; sets the mode used for fitting |
fit.method | fit_DoseResponseCurve | as in fit_DoseResponseCurve; sets the function applied for fitting |
How to cite
Kreutzer, S., 2025. analyse_Al2O3C_ITC(): Al2O3 Irradiation Time Correction Analysis. Function version 0.1.1. In: Kreutzer, S., Burow, C., Dietze, M., Fuchs, M.C., Schmidt, C., Fischer, M., Friedrich, J., Mercier, N., Philippe, A., Riedesel, S., Autzen, M., Mittelstrass, D., Gray, H.J., Galharret, J., Colombo, M., Steinbuch, L., Boer, A.d., 2025. Luminescence: Comprehensive Luminescence Dating Data Analysis. R package version 1.1.2. https://r-lum.github.io/Luminescence/
References
Kreutzer, S., Martin, L., Guérin, G., Tribolo, C., Selva, P., Mercier, N., 2018. Environmental Dose Rate Determination Using a Passive Dosimeter: Techniques and Workflow for alpha-Al2O3:C Chips. Geochronometria 45, 56-67. doi: 10.1515/geochr-2015-0086
Author
Sebastian Kreutzer, Institute of Geography, Heidelberg University (Germany) , RLum Developer Team
Examples
##load data
data(ExampleData.Al2O3C, envir = environment())

##run analysis
analyse_Al2O3C_ITC(data_ITC)
#>
#> [analyse_Al2O3C_ITC()]
#>
#>  Used fit method:		 EXP
#>  Time correction value:	 2.587 ± 0.038
#>

#>
#>  [RLum.Results-class]
#> 	 originator: analyse_Al2O3C_ITC()
#> 	 data: 4
#>  	 .. $data : data.frame
#> 	 .. $table : data.frame
#> 	 .. $table_mean : data.frame
#> 	 .. $fit : nls
#> 	 additional info elements:  1
#>
#> [RLum.Results-class]
#> originator: analyse_Al2O3C_ITC()
#> data: 4
#> .. $data : data.frame
#> .. $table : data.frame
#> .. $table_mean : data.frame
#> .. $fit : nls
#> additional info elements: 1