Example data for feldspar fading measurements
Source:R/Luminescence-package.R
ExampleData.Fading.RdExample data set for fading measurements of the IR50, IR100, IR150 and IR225 feldspar signals of sample UNIL/NB123. It further contains regular equivalent dose measurement data of the same sample, which can be used to apply a fading correction to.
Format
A list with two elements, each containing a further list of data.frames containing the data on the fading and equivalent dose measurements:
-
$fading.data: A named list of data.frames,
each having three named columns (LxTx, LxTx.error, timeSinceIrradiation).
..$IR50: Fading data of the IR50 signal.
..$IR100: Fading data of the IR100 signal.
..$IR150: Fading data of the IR150 signal.
..$IR225: Fading data of the IR225 signal.
$equivalentDose.data: A named of data.frames,
each having three named columns (dose, LxTx, LxTx.error).
..$IR50: Equivalent dose measurement data of the IR50 signal.
..$IR100: Equivalent dose measurement data of the IR100 signal.
..$IR150: Equivalent dose measurement data of the IR150 signal.
..$IR225: Equivalent dose measurement data of the IR225 signal.
Source
These data were kindly provided by Georgina E. King. Detailed information on the sample UNIL/NB123 can be found in the reference given below. The raw data can be found in the accompanying supplementary information.
References
King, G.E., Herman, F., Lambert, R., Valla, P.G., Guralnik, B., 2016. Multi-OSL-thermochronometry of feldspar. Quaternary Geochronology 33, 76-87. doi:10.1016/j.quageo.2016.01.004
Details
| Lab: | University of Lausanne |
| Lab-Code: | UNIL/NB123 |
| Location: | Namche Barwa (eastern Himalayas) |
| Material: | Coarse grained (180-212 microns) potassium feldspar |
| Units: | Values are given in seconds |
| Lab Dose Rate: | Dose rate of the beta-source at measurement ca. 0.1335 +/- 0.004 Gy/s |
| Environmental Dose Rate: | 7.00 +/- 0.92 Gy/ka (includes internal dose rate) |
Examples
## Load example data
data("ExampleData.Fading", envir = environment())
## Get fading measurement data of the IR50 signal
IR50_fading <- ExampleData.Fading$fading.data$IR50
head(IR50_fading)
#> LxTx LxTx.error timeSinceIrradiation
#> 1 0.980 0.0490 381.6
#> 2 0.952 0.0476 12178.8
#> 3 0.924 0.0462 18183.6
#> 4 0.912 0.0456 30178.8
#> 5 0.898 0.0449 54172.8
#> 6 0.974 0.0487 378.0
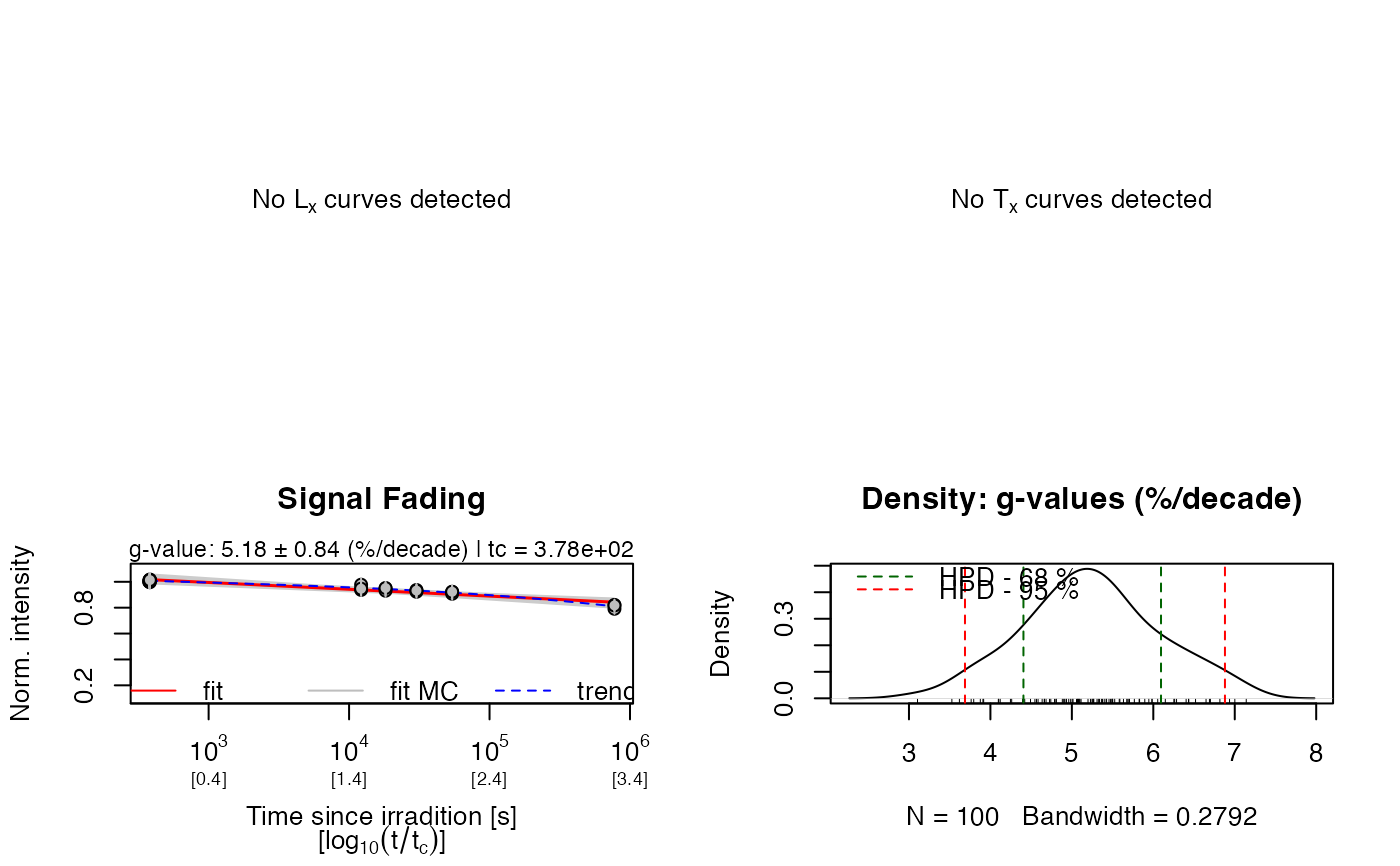
## Determine g-value and rho' for the IR50 signal
IR50_fading.res <- analyse_FadingMeasurement(IR50_fading)
 #>
#> [analyse_FadingMeasurement()]
#>
#> n.MC: 100
#> tc: 3.78e+02 s
#> ---------------------------------------------------
#> T_0.5 interpolated: NA
#> T_0.5 predicted: 4e+11
#> g-value: 5.18 ± 0.72 (%/decade)
#> g-value (norm. 2 days): 6.01 ± 0.73 (%/decade)
#> ---------------------------------------------------
#> rho': 3.91e-06 ± 6.03e-07
#> log10(rho'): -5.41 ± 0.07
#> ---------------------------------------------------
## Show g-value and rho' results
gval <- get_RLum(IR50_fading.res)
rhop <- get_RLum(IR50_fading.res, "rho_prime")
gval
#> FIT MEAN SD Q_0.025 Q_0.16 Q_0.84 Q_0.975
#> G_VALUE_2DAYS 5.182106 5.083861 0.7178726 3.629961 4.43232 5.785543 6.606997
#> TC G_VALUE_2DAYS G_VALUE_2DAYS.ERROR T_0.5_INTERPOLATED
#> G_VALUE_2DAYS 378 6.010655 0.7318478 NA
#> T_0.5_PREDICTED T_0.5_PREDICTED.LOWER T_0.5_PREDICTED.UPPER
#> G_VALUE_2DAYS 395648134315 18339400088 18339400088
#> UID
#> G_VALUE_2DAYS 143bc9b250686433
rhop
#> FIT MEAN SD Q_0.025 Q_0.16 Q_0.84
#> 1 3.912967e-06 3.912967e-06 6.027167e-07 2.757662e-06 3.236705e-06 4.522956e-06
#> Q_0.975
#> 1 4.884235e-06
## Get LxTx values of the IR50 DE measurement
IR50_De.LxTx <- ExampleData.Fading$equivalentDose.data$IR50
## Calculate the De of the IR50 signal
IR50_De <- fit_DoseResponseCurve(IR50_De.LxTx,
mode = "interpolation",
fit.method = "EXP")
#> [fit_DoseResponseCurve()] Fit: EXP (interpolation) | De = 977.38 | D01 = 4022.47
## Extract the calculated De and its error
IR50_De.res <- get_RLum(IR50_De)
De <- c(IR50_De.res$De, IR50_De.res$De.Error)
## Apply fading correction (age conversion greatly simplified)
IR50_Age <- De / 7.00
IR50_Age.corr <- calc_FadingCorr(IR50_Age, g_value = IR50_fading.res)
#>
#>
#> [calc_FadingCorr()]
#>
#> >> Fading correction according to Huntley & Lamothe (2001)
#>
#> .. used g-value: 5.182 ± 0.718 %/decade
#> .. used tc: 1.198e-08 ka
#> .. used kappa: 0.0225 ± 0.0031
#> ----------------------------------------------
#> seed: NA
#> n.MC: 10000
#> observations: 10000
#> ----------------------------------------------
#> Age (faded): 139.6261 ka ± 14.6489 ka
#> Age (corr.): 288.1629 ka ± 61.3833 ka
#> ----------------------------------------------
#>
#> [analyse_FadingMeasurement()]
#>
#> n.MC: 100
#> tc: 3.78e+02 s
#> ---------------------------------------------------
#> T_0.5 interpolated: NA
#> T_0.5 predicted: 4e+11
#> g-value: 5.18 ± 0.72 (%/decade)
#> g-value (norm. 2 days): 6.01 ± 0.73 (%/decade)
#> ---------------------------------------------------
#> rho': 3.91e-06 ± 6.03e-07
#> log10(rho'): -5.41 ± 0.07
#> ---------------------------------------------------
## Show g-value and rho' results
gval <- get_RLum(IR50_fading.res)
rhop <- get_RLum(IR50_fading.res, "rho_prime")
gval
#> FIT MEAN SD Q_0.025 Q_0.16 Q_0.84 Q_0.975
#> G_VALUE_2DAYS 5.182106 5.083861 0.7178726 3.629961 4.43232 5.785543 6.606997
#> TC G_VALUE_2DAYS G_VALUE_2DAYS.ERROR T_0.5_INTERPOLATED
#> G_VALUE_2DAYS 378 6.010655 0.7318478 NA
#> T_0.5_PREDICTED T_0.5_PREDICTED.LOWER T_0.5_PREDICTED.UPPER
#> G_VALUE_2DAYS 395648134315 18339400088 18339400088
#> UID
#> G_VALUE_2DAYS 143bc9b250686433
rhop
#> FIT MEAN SD Q_0.025 Q_0.16 Q_0.84
#> 1 3.912967e-06 3.912967e-06 6.027167e-07 2.757662e-06 3.236705e-06 4.522956e-06
#> Q_0.975
#> 1 4.884235e-06
## Get LxTx values of the IR50 DE measurement
IR50_De.LxTx <- ExampleData.Fading$equivalentDose.data$IR50
## Calculate the De of the IR50 signal
IR50_De <- fit_DoseResponseCurve(IR50_De.LxTx,
mode = "interpolation",
fit.method = "EXP")
#> [fit_DoseResponseCurve()] Fit: EXP (interpolation) | De = 977.38 | D01 = 4022.47
## Extract the calculated De and its error
IR50_De.res <- get_RLum(IR50_De)
De <- c(IR50_De.res$De, IR50_De.res$De.Error)
## Apply fading correction (age conversion greatly simplified)
IR50_Age <- De / 7.00
IR50_Age.corr <- calc_FadingCorr(IR50_Age, g_value = IR50_fading.res)
#>
#>
#> [calc_FadingCorr()]
#>
#> >> Fading correction according to Huntley & Lamothe (2001)
#>
#> .. used g-value: 5.182 ± 0.718 %/decade
#> .. used tc: 1.198e-08 ka
#> .. used kappa: 0.0225 ± 0.0031
#> ----------------------------------------------
#> seed: NA
#> n.MC: 10000
#> observations: 10000
#> ----------------------------------------------
#> Age (faded): 139.6261 ka ± 14.6489 ka
#> Age (corr.): 288.1629 ka ± 61.3833 ka
#> ----------------------------------------------