Analyse post-IR IRSL measurement sequences
Source:R/analyse_pIRIRSequence.R
analyse_pIRIRSequence.RdThe function performs an analysis of post-IR IRSL sequences including curve fitting on RLum.Analysis objects.
Arguments
- object
RLum.Analysis or list of RLum.Analysis objects (required): input object containing data for analysis. If a list is provided the functions tries to iterate over each element in the list.
- signal_integral
integer (required): vector of channels for the signal integral. Provide this value as a list for different integration limits for the different IRSL curves.
- background_integral
integer (required): vector of channels for the background integral. Provide this value as a list for different integration limits for the different IRSL curves.
- integral_input
character (with default): input type for
signal_integral, one of"channel"(default) or"measurement". If set to"measurement", the best matching channels corresponding to the given time range (in seconds) are selected.- dose.points
numeric (optional): a numeric vector containing the dose points values. Using this argument overwrites dose point values in the signal curves.
- sequence.structure
vector character (with default): specifies the general sequence structure. Allowed values are
"TL"and any"IR"combination (e.g.,"IR50","pIRIR225"). Additionally a parameter"EXCLUDE"is allowed to exclude curves from the analysis (Note: If a preheat without PMT measurement is used, i.e. preheat as none TL, remove the TL step.)- plot
logical (with default): enable/disable the plot output.
- plot_singlePanels
logical (with default): enable/disable plotting of the results in a single windows for each plot. Ignored if
plot = FALSE.- ...
further arguments that will be passed to analyse_SAR.CWOSL and plot_DoseResponseCurve. Furthermore, the arguments
main(headers),log(IRSL curves),cex(control the size) andmtext.outer(additional text on the plot area) can be passed to influence the plotting. If the input is a list,maincan be passed as vector or list.
Value
Plots (optional) and an RLum.Results object is returned containing the following elements:
| DATA.OBJECT | TYPE | DESCRIPTION |
..$data : | data.frame | Table with De values |
..$LnLxTnTx.table : | data.frame | with the LnLxTnTx values |
..$rejection.criteria : | data.frame | rejection criteria |
..$Formula : | list | Function used for fitting of the dose response curve |
..$call : | call | the original function call |
The output should be accessed using the function get_RLum.
Details
To allow post-IR IRSL protocol (Thomsen et al., 2008) measurement analyses, this function has been written as extended wrapper for function analyse_SAR.CWOSL, thus facilitating an entire sequence analysis in one run. With this, its functionality is strictly limited by the functionality provided by analyse_SAR.CWOSL.
Defining the sequence structure
The argument sequence.structure expects a shortened pattern of your
sequence structure and was mainly introduced to ease the use of the function.
For example: If your measurement data contains the following curves: TL,
IRSL, IRSL, TL, IRSL, IRSL, the pattern in sequence.structure
becomes c('TL', 'IRSL', 'IRSL'). The second part of your sequence for one
cycle should be similar and can be discarded. If this is not the case (e.g.,
additional hotbleach) such curves must be removed before using the function.
If the input is a list
If the input is a list of RLum.Analysis objects, every argument can be provided as list to allow for different sets of parameters for every single input element. For further information see analyse_SAR.CWOSL.
Note
Best graphical output can be achieved by using the function pdf
with the following options:
pdf(file = "<YOUR FILENAME>", height = 18, width = 18)
How to cite
Kreutzer, S., 2026. analyse_pIRIRSequence(): Analyse post-IR IRSL measurement sequences. Function version 0.2.8. In: Kreutzer, S., Burow, C., Dietze, M., Fuchs, M.C., Schmidt, C., Fischer, M., Friedrich, J., Mercier, N., Philippe, A., Riedesel, S., Autzen, M., Mittelstrass, D., Gray, H.J., Galharret, J., Colombo, M., Steinbuch, L., Boer, A.d., Bluszcz, A., 2026. Luminescence: Comprehensive Luminescence Dating Data Analysis. R package version 1.2.1. https://r-lum.github.io/Luminescence/
References
Murray, A.S., Wintle, A.G., 2000. Luminescence dating of quartz using an improved single-aliquot regenerative-dose protocol. Radiation Measurements 32, 57-73. doi:10.1016/S1350-4487(99)00253-X
Thomsen, K.J., Murray, A.S., Jain, M., Boetter-Jensen, L., 2008. Laboratory fading rates of various luminescence signals from feldspar-rich sediment extracts. Radiation Measurements 43, 1474-1486. doi:10.1016/j.radmeas.2008.06.002
Author
Sebastian Kreutzer, F2.1 Geophysical Parametrisation/Regionalisation, LIAG - Institute for Applied Geophysics (Germany) , RLum Developer Team
Examples
### NOTE: For this example existing example data are used. These data are non pIRIR data.
###
##(1) Compile example data set based on existing example data (SAR quartz measurement)
##(a) Load example data
data(ExampleData.BINfileData, envir = environment())
##(b) Transform the values from the first position in a RLum.Analysis object
object <- Risoe.BINfileData2RLum.Analysis(CWOSL.SAR.Data, pos=1)
##(c) Grep curves and exclude the last two (one TL and one IRSL)
object <- get_RLum(object, record.id = c(-29,-30))
##(d) Define new sequence structure and set new RLum.Analysis object
sequence.structure <- c(1,2,2,3,4,4)
sequence.structure <- as.vector(sapply(seq(0,length(object)-1,by = 4),
function(x){sequence.structure + x}))
object <- sapply(1:length(sequence.structure), function(x){
object[[sequence.structure[x]]]
})
object <- set_RLum(class = "RLum.Analysis", records = object, protocol = "pIRIR")
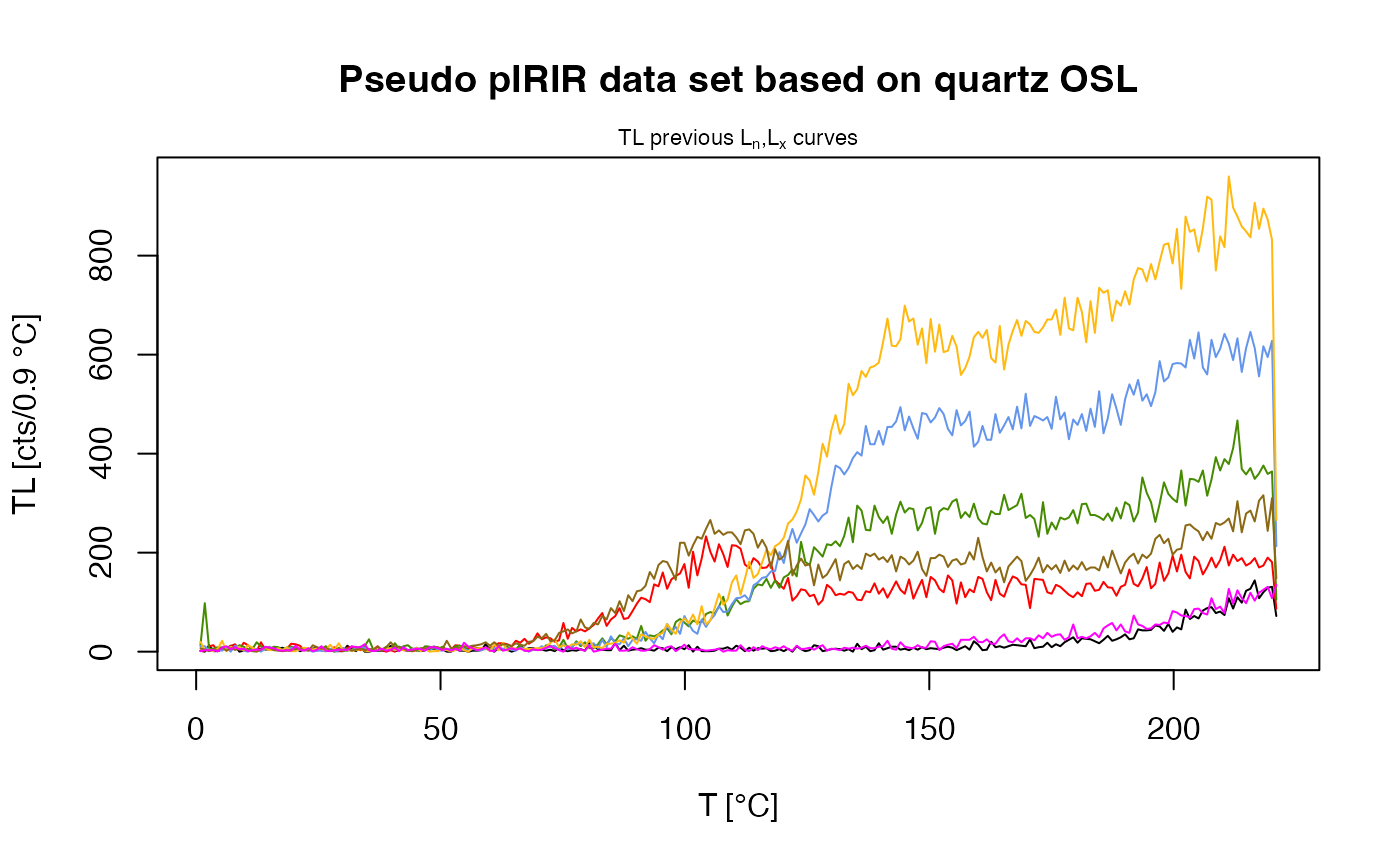
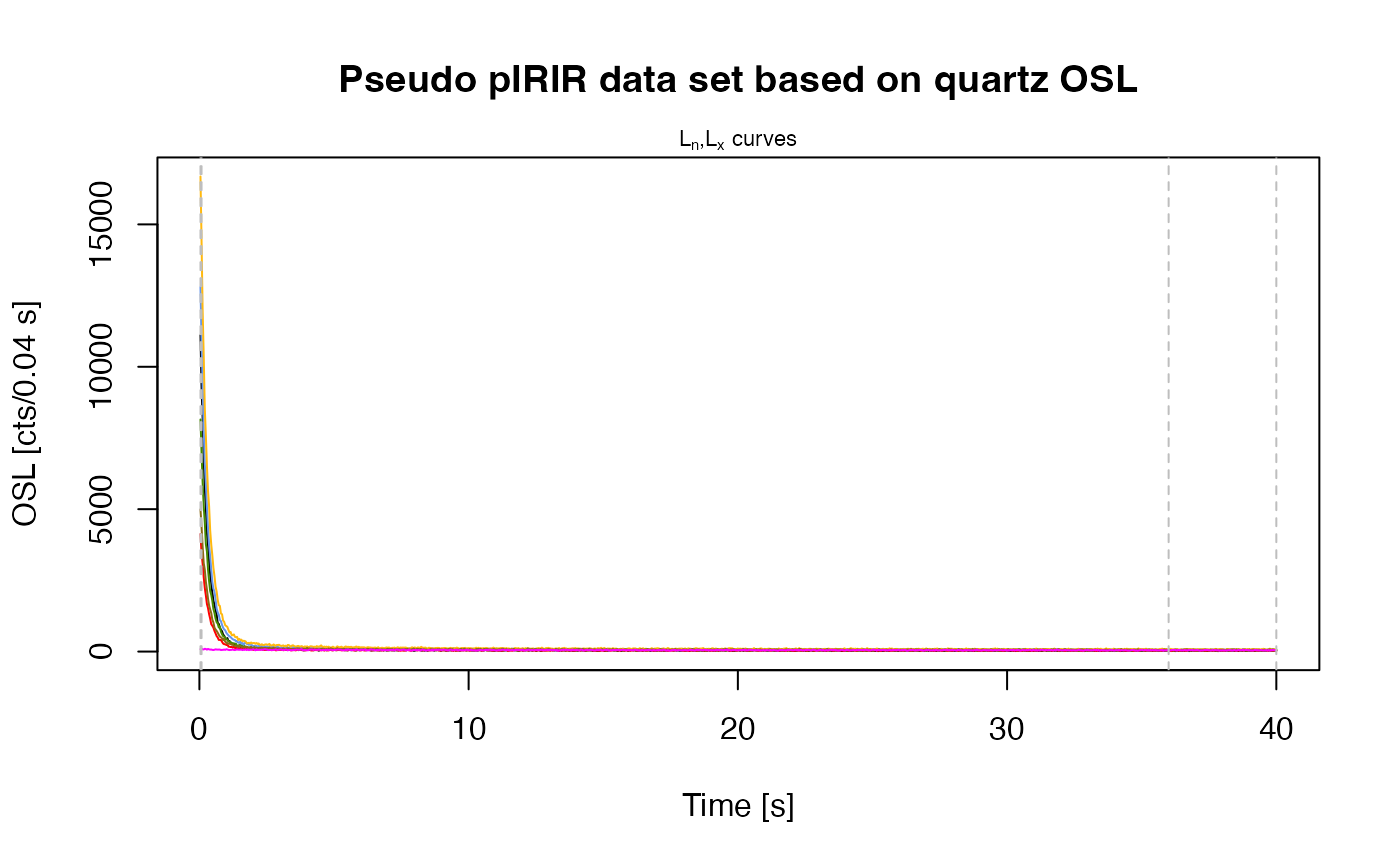
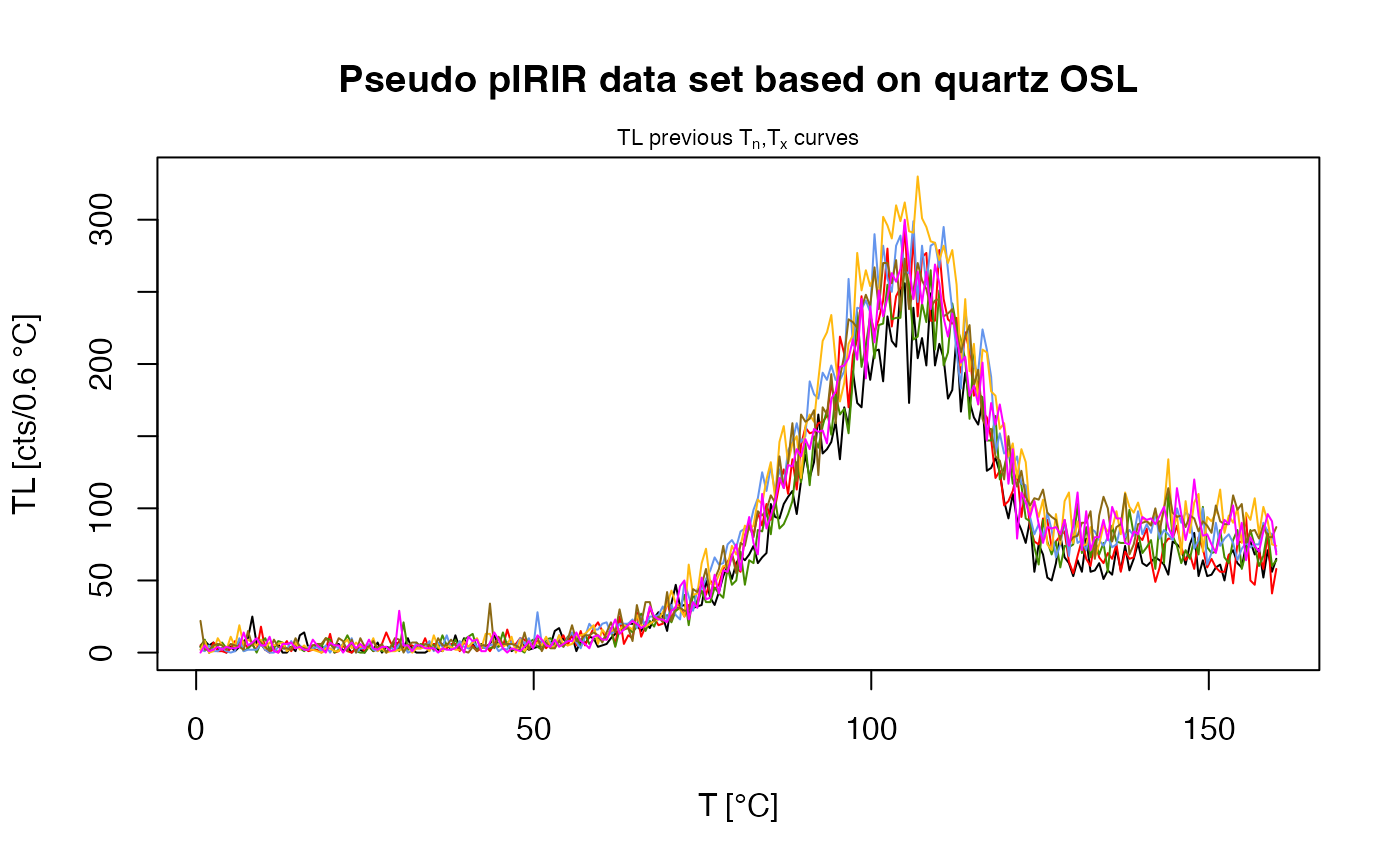
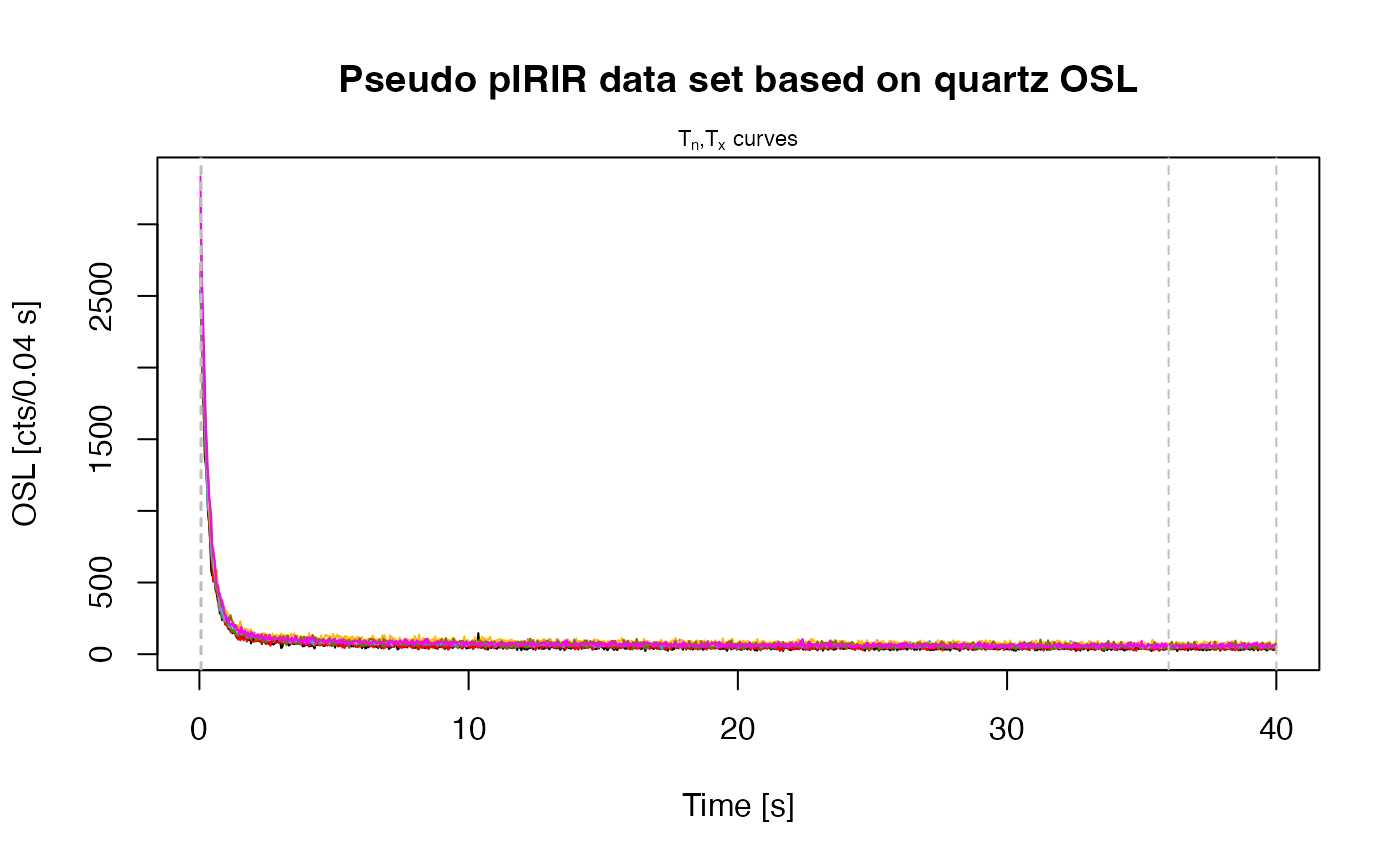
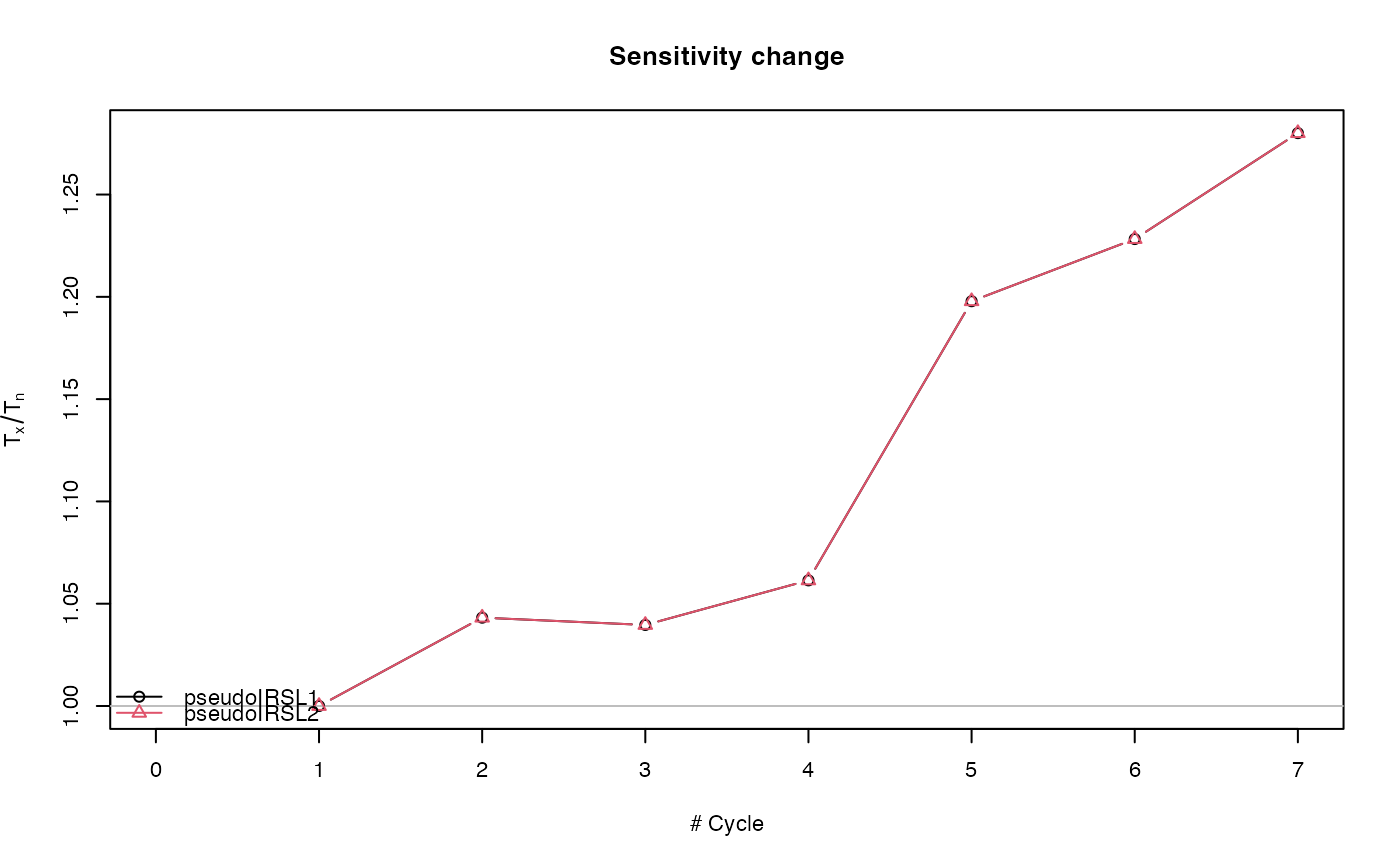
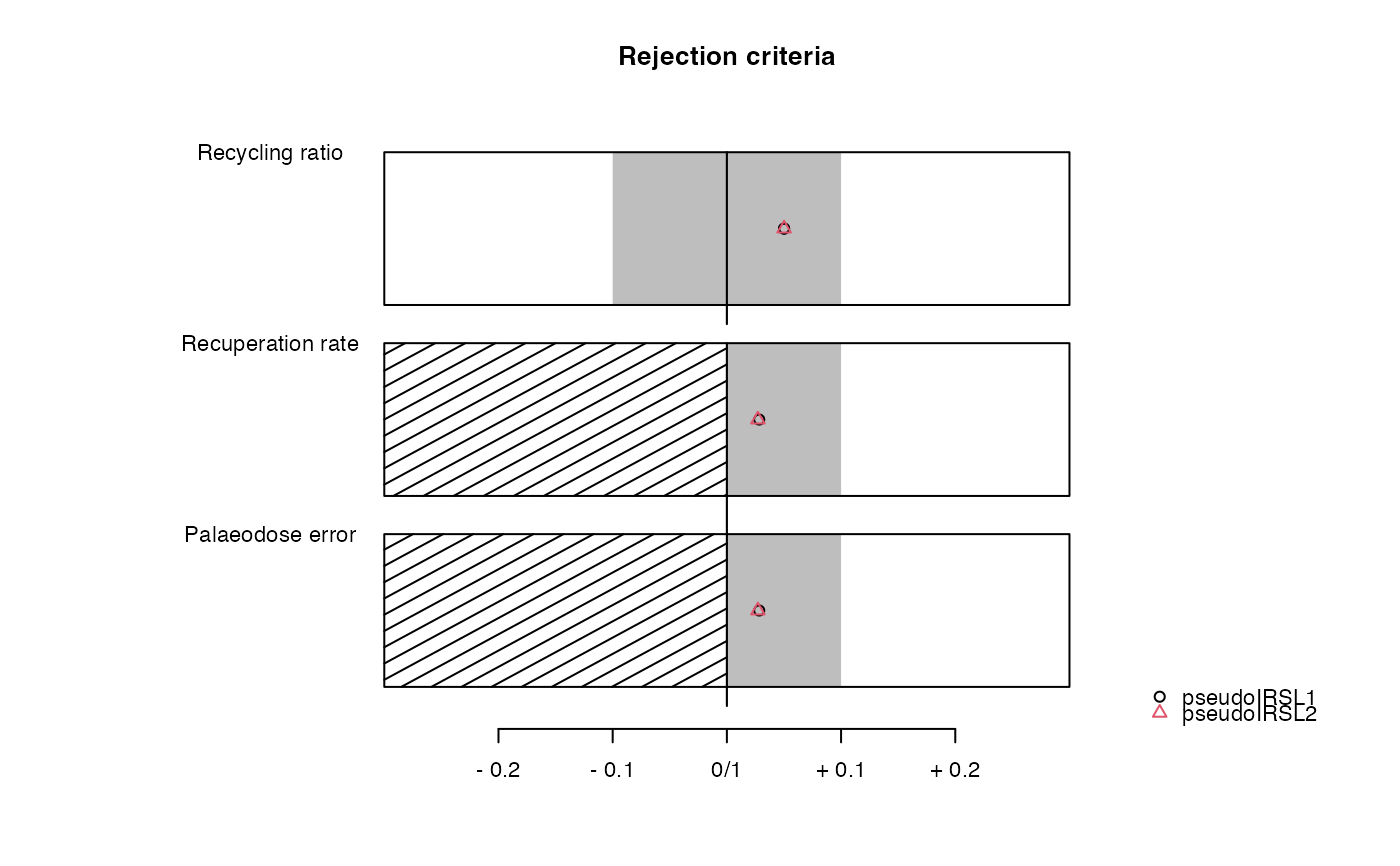
##(2) Perform pIRIR analysis (for this example with quartz OSL data!)
## Note: output as single plots to avoid problems with this example
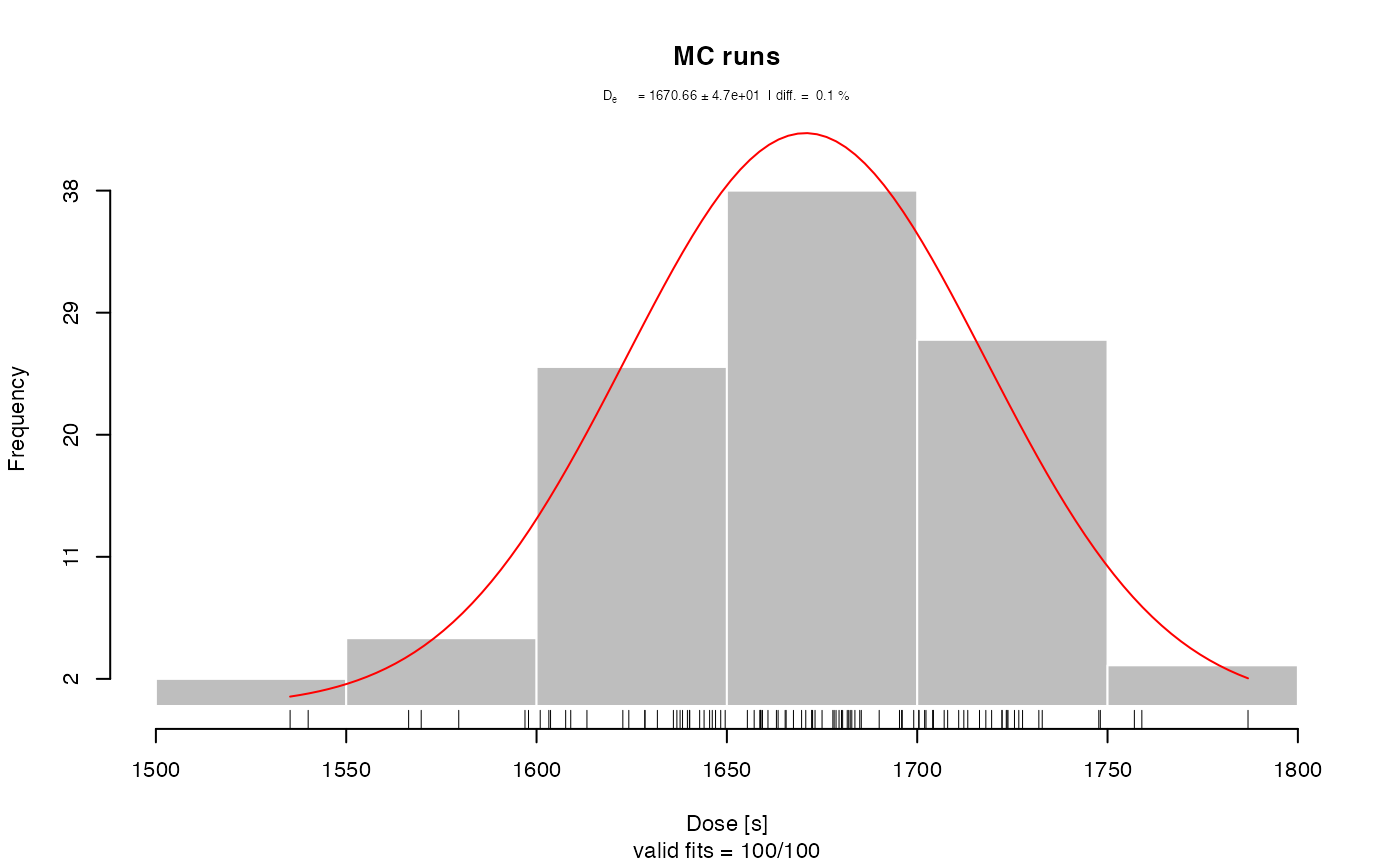
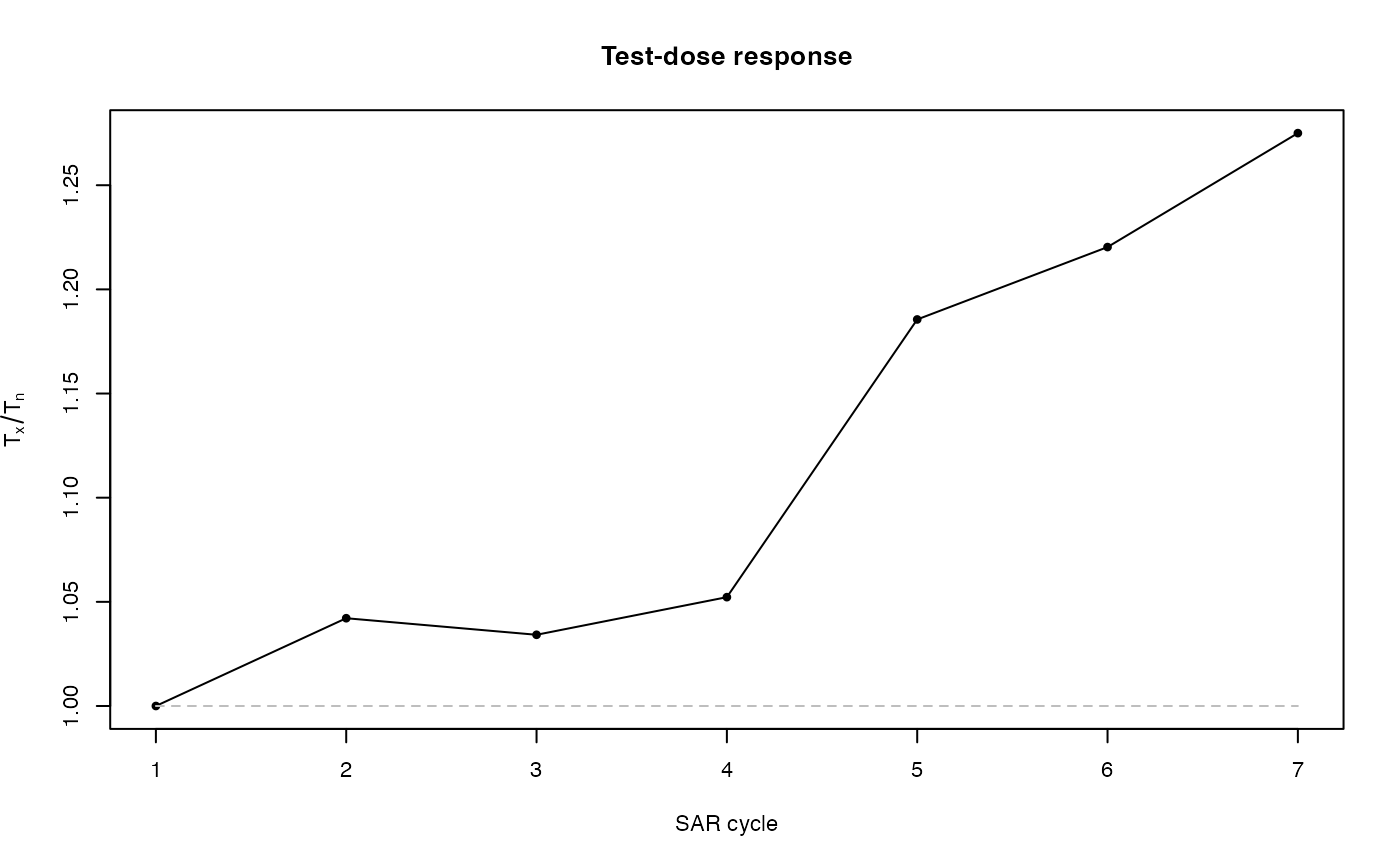
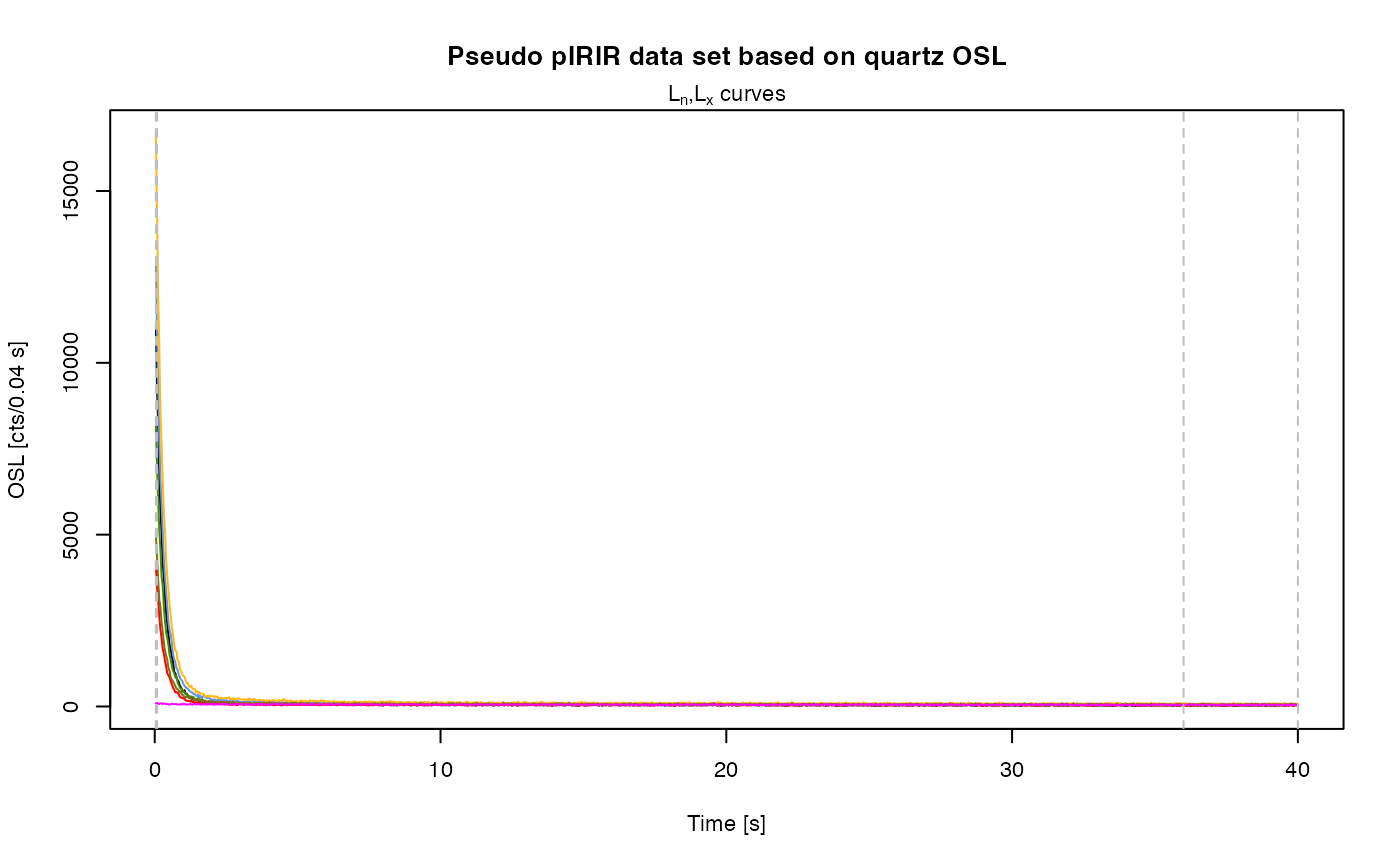
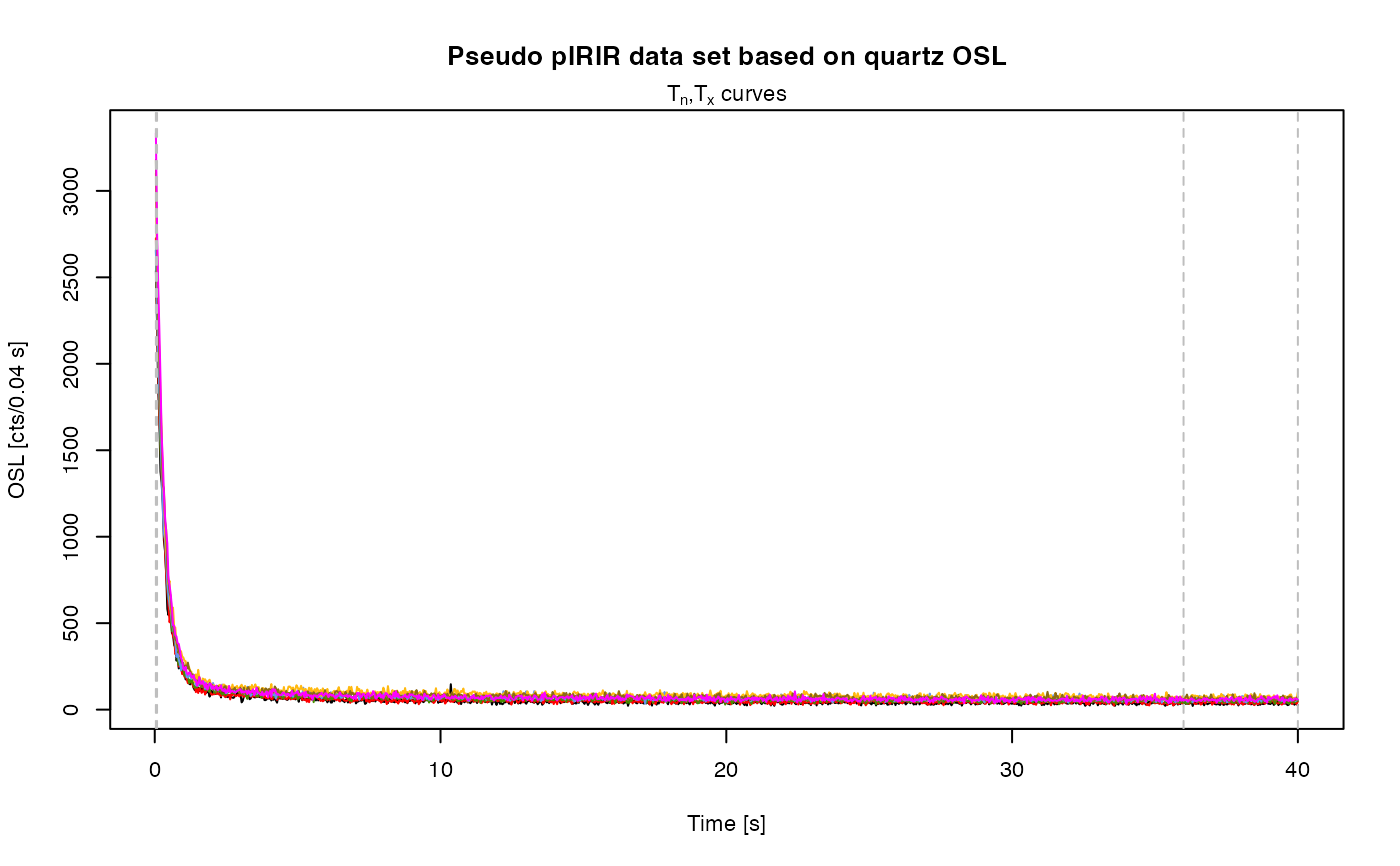
results <- analyse_pIRIRSequence(object,
signal_integral = 1:2,
background_integral = 900:1000,
fit.method = "EXP",
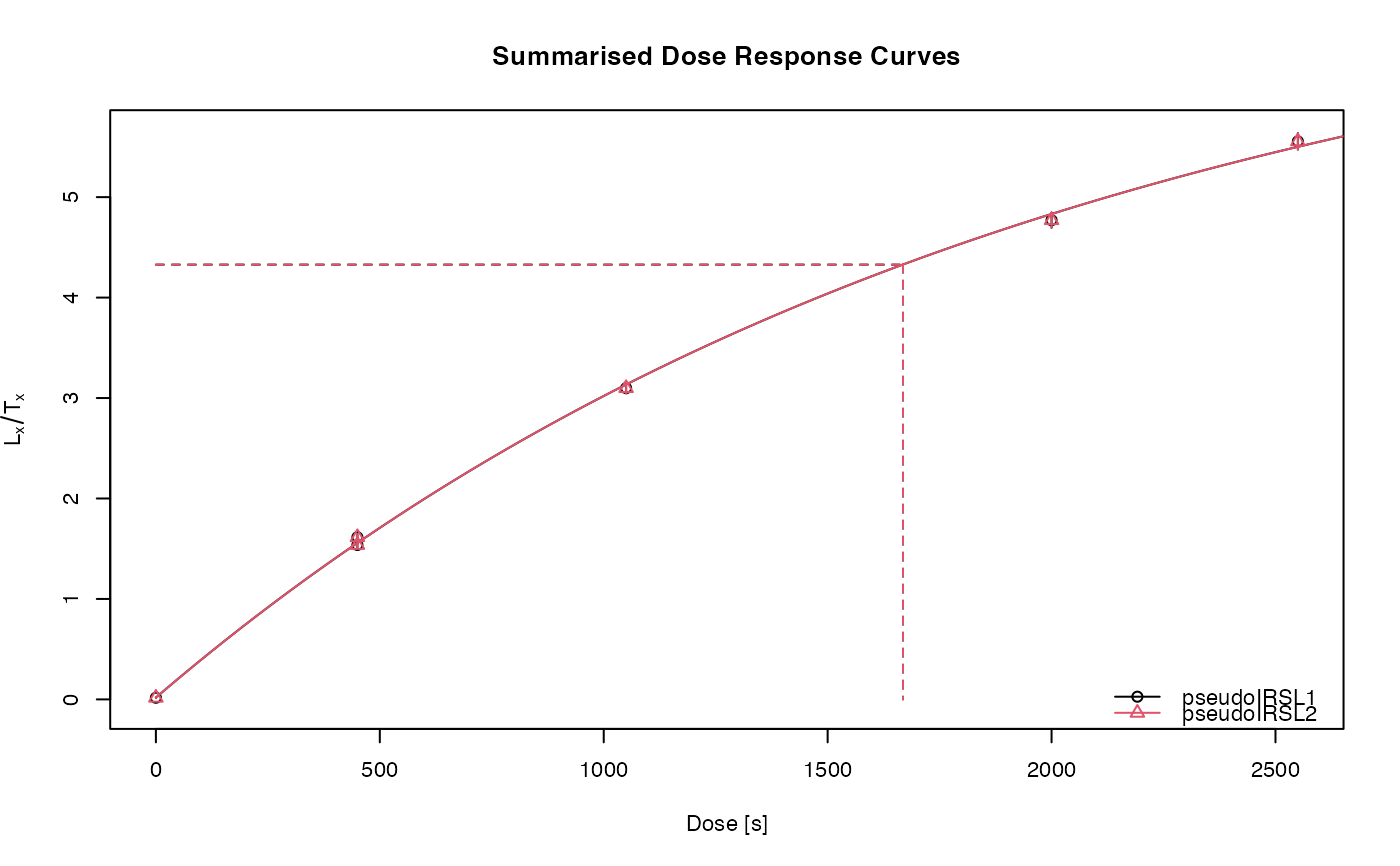
sequence.structure = c("TL", "pseudoIRSL1", "pseudoIRSL2"),
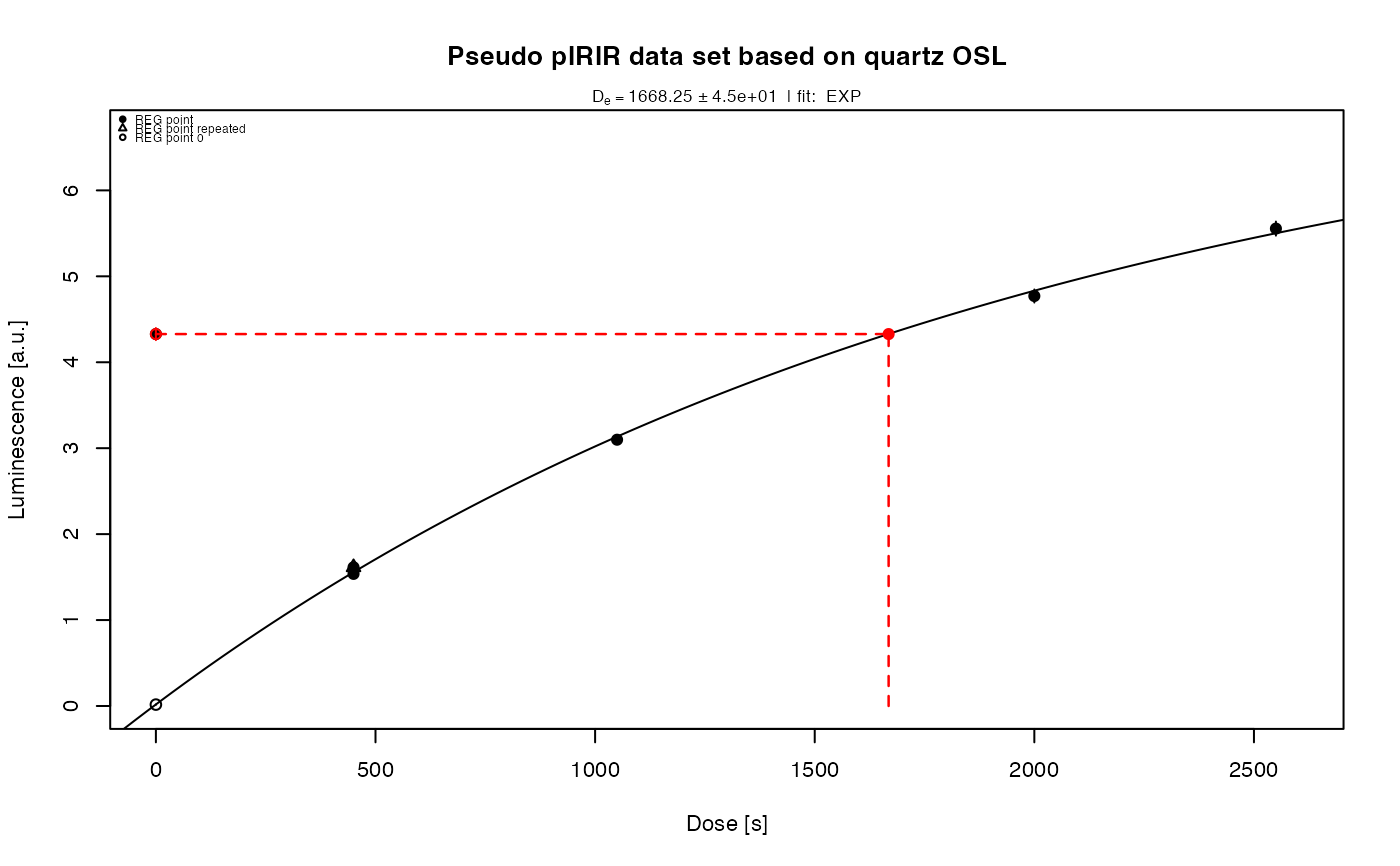
main = "Pseudo pIRIR data set based on quartz OSL",
plot_singlePanels = TRUE)

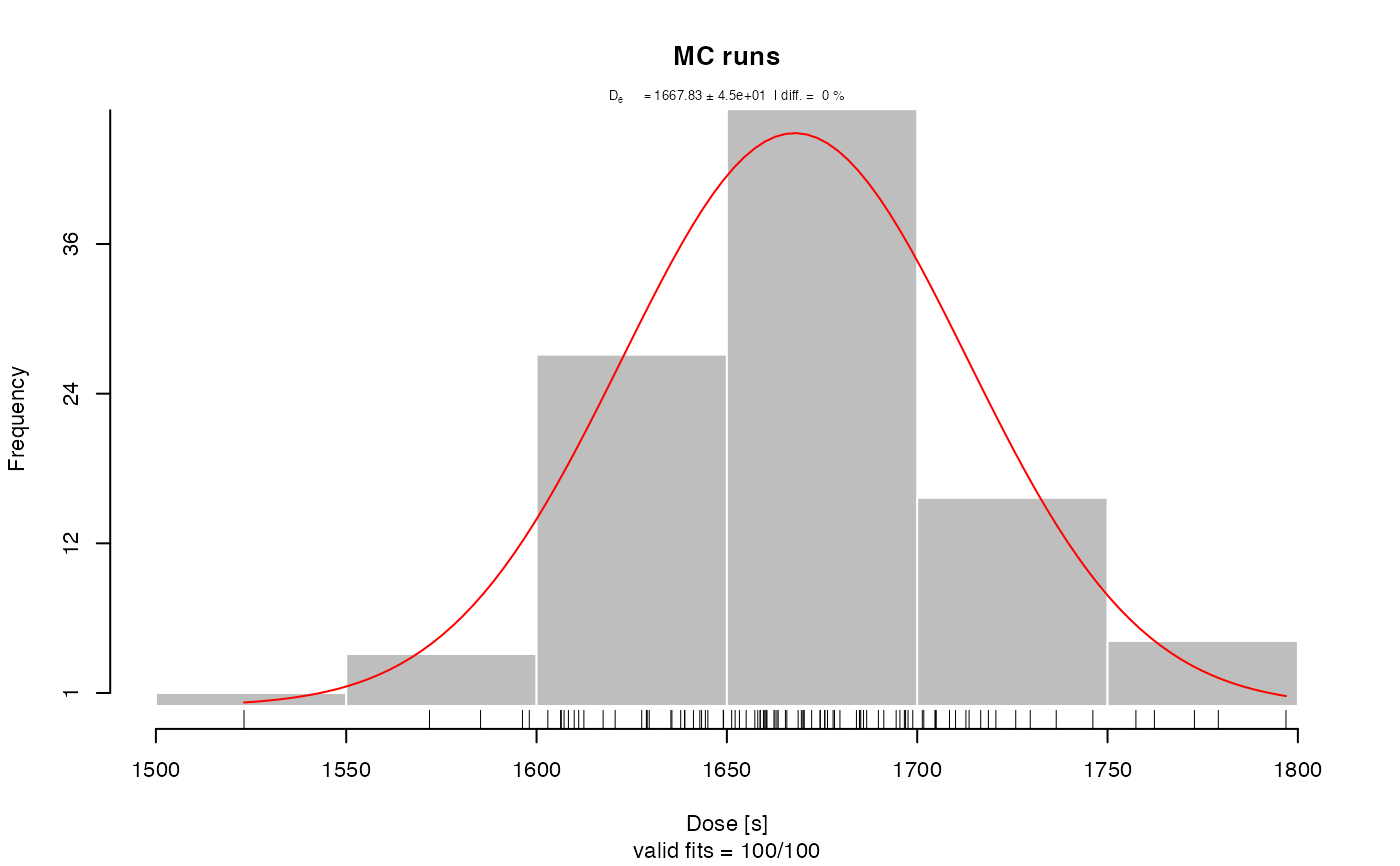
 #> [analyse_SAR.CWOSL()] Fit: EXP (interpolation) | De = 1668.28 | D01 = 1982.52

 #> [analyse_SAR.CWOSL()] Fit: EXP (interpolation) | De = 1668.28 | D01 = 1982.52

 ##(3) Perform pIRIR analysis (for this example with quartz OSL data!)
## Alternative for PDF output, uncomment and complete for usage
if (FALSE) { # \dontrun{
tempfile <- tempfile(fileext = ".pdf")
pdf(file = tempfile, height = 18, width = 18)
results <- analyse_pIRIRSequence(object,
signal_integral = 1:2,
background_integral = 900:1000,
fit.method = "EXP",
main = "Pseudo pIRIR data set based on quartz OSL")
dev.off()
} # }
##(3) Perform pIRIR analysis (for this example with quartz OSL data!)
## Alternative for PDF output, uncomment and complete for usage
if (FALSE) { # \dontrun{
tempfile <- tempfile(fileext = ".pdf")
pdf(file = tempfile, height = 18, width = 18)
results <- analyse_pIRIRSequence(object,
signal_integral = 1:2,
background_integral = 900:1000,
fit.method = "EXP",
main = "Pseudo pIRIR data set based on quartz OSL")
dev.off()
} # }